Full Report
The numbers behind Lyft, Inc.: as-reported financial statements and company metrics for FY2021–FY2025, traced to the source filings, opened with the share-price history those statements have to justify. Every linked figure opens the exact page of the filing it was printed on, with the statement row highlighted. Amounts in US$ thousands unless noted.
Reading notes: All figures are in US$ thousands, as printed on the filings' consolidated statements ('in thousands, except per-share data'). Lyft's fiscal year ends December 31. Revenue is Total revenue = Revenue from contracts with customers (ASC 606) + Rental revenue (ASC 842). The standardized data feed captured only the ASC 606 component; the filed audited Total revenue line is used for every year (see discrepancies). FY2025 net income of $2.844bn is driven by a $2.9bn income-tax benefit from the release of the deferred-tax-asset valuation allowance (deferred tax assets on the balance sheet rose to $2.906bn); pre-tax result was a $53m loss. FY2021 income-statement and balance-sheet columns are the restated comparatives from the FY2022 Form 10-K, not the as-originally-filed FY2021 10-K (see discrepancies).
Share Price — Full Available History — 7 Years
The stock closed at $14.20 on Jul 24, 2026 — down 82% over the window shown (-20.8% a year), trading between $7.99 and $78.29. At that close the stock trades at 2.1× FY2025 diluted EPS as reported below.
Source: market price feed, weekly closes, sampled from 1,841 source observations, Mar 2019–Jul 2026. Price return only, excludes dividends.
Market capitalization $3.2bn and enterprise value $3.2bn.
Market cap = 227.5M shares outstanding × the Jul 24, 2026 close of $14.20. Enterprise value adds total debt of $1.1bn and subtracts cash and equivalents of $1.1bn (net cash of $79mn), from the FY2025 balance sheet. Market-derived figures, shown without filing links.
FY2025 at a Glance
Revenue (US$ thousands)
Net income (US$ thousands)
Diluted EPS
Source: FY2025 consolidated statements [1] [2] [3] [4]. Click any linked figure to open the filing page with the row highlighted.
Revenue by Type (ASC 606 vs. Rental)
| Revenue by Type (ASC 606 vs. Rental) | FY2021 | FY2022 | FY2023 | FY2024 | FY2025 |
|---|---|---|---|---|---|
| Revenue from contracts with customers (ASC 606) | 2,957,979 | 3,811,993 | 4,116,216 | 5,365,534 | 5,895,475 |
| Rental revenue (ASC 842) | 250,344 | 283,142 | 287,373 | 420,482 | 420,786 |
| Total revenue | 3,208,323 | 4,095,135 | 4,403,589 | 5,786,016 | 6,316,261 |
| Total revenue growth, derived | — | +27.6% | +7.5% | +31.4% | +9.2% |
Source: Note 3, Revenue — revenues as presented on the Consolidated Statements of Operations [5] [6]. Click any linked figure to open the filing page with the row highlighted.
Income Statement
Source: Consolidated Statements of Operations [1] [2] [3] [4]. Click any linked figure to open the filing page with the row highlighted.
Columns marked E are consensus analyst estimates from S&P Capital IQ (CapIQ), shown alongside reported results for direct comparison; they are not company guidance.
Estimate source: S&P Capital IQ (CapIQ) consensus, as of 2026-07-24. Estimate figures are S&P Capital IQ consensus (vendor data — no filing page links). EPS and net income use the normalized (adjusted) consensus where the street reports it. Line-item analyst models (segments, drivers, KPIs) are in the Visible Alpha tab.
Balance Sheet
Source: Consolidated Balance Sheets [7] [8] [9]. Click any linked figure to open the filing page with the row highlighted.
Cash Flow
Source: Consolidated Statements of Cash Flows [10] [11]. Click any linked figure to open the filing page with the row highlighted.
Profitability Operating Leverage (Non-GAAP)
| Profitability Operating Leverage (Non-GAAP) | FY2021 | FY2022 | FY2023 | FY2024 | FY2025 |
|---|---|---|---|---|---|
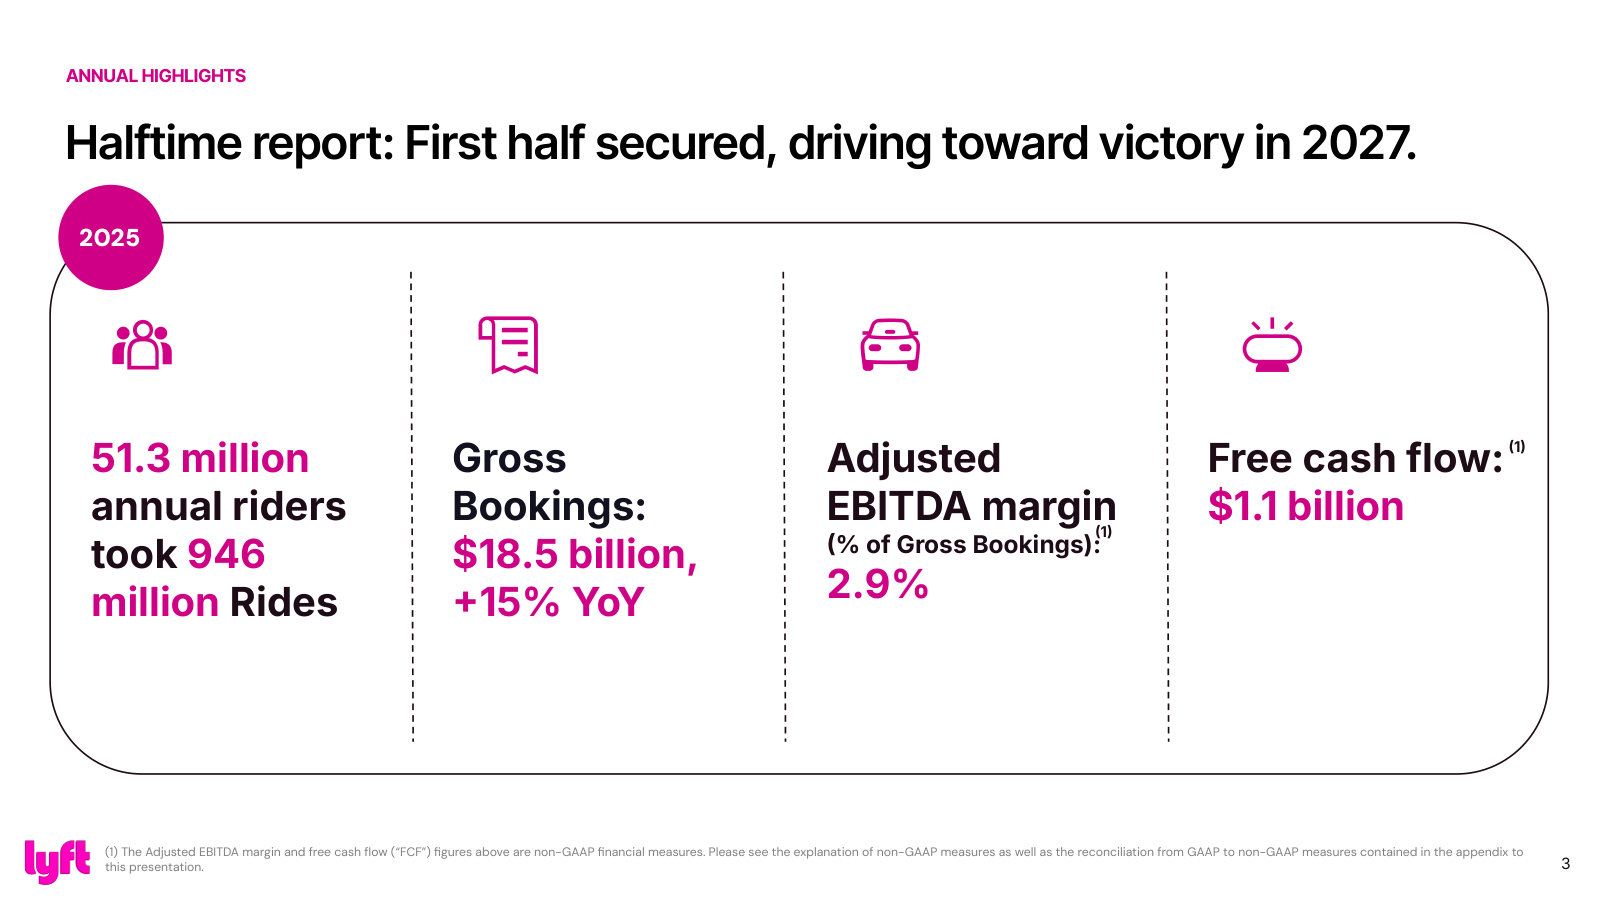
| Adjusted EBITDA margin (% of Gross Bookings) | (1.6%) | (3.5%) | 1.6% | 2.4% | 2.9% |
| Net income (loss) as a % of Gross Bookings | (10.9%) | (13.1%) | (2.5%) | 0.1% | 15.4% |
| Net income (loss) as a % of revenue | (33.1%) | (38.7%) | (7.7%) | 0.4% | 45.0% |
Source: company filings [12] [13]. Click any linked figure to open the filing page with the row highlighted.
Cash Generation, Dilution Capital Returns
| Cash Generation, Dilution Capital Returns | FY2021 | FY2022 | FY2023 | FY2024 | FY2025 |
|---|---|---|---|---|---|
| Free cash flow (OCF less capex) | (180,900) | (352,300) | (248,100) | 766,300 | 1,115,600 |
| Adjusted Net Income (Loss) | (332,600) | (531,400) | 250,700 | 391,500 | — |
| Stock-based compensation | 724,560 | 750,767 | 484,533 | 330,921 | 322,268 |
Source: company filings [10] [12] [14] [13]. Click any linked figure to open the filing page with the row highlighted.
Legacy Unit Economics (metrics discontinued after FY2022)
| Legacy Unit Economics (metrics discontinued after FY2022) | FY2021 | FY2022 | FY2023 | FY2024 | FY2025 |
|---|---|---|---|---|---|
| Revenue per Active Rider (Q4) | 51.79 | 57.72 | — | — | — |
| Contribution | 1,631,300 | 1,729,800 | — | — | — |
| Contribution Margin | 50.8% | 42.2% | — | — | — |
| Gross profit margin | 46.9% | 40.5% | — | — | — |
Source: company filings [15]. Click any linked figure to open the filing page with the row highlighted.
Long-Term Record
| Fiscal year | Total revenue | Net income (loss) | Diluted net income (loss) per share | Net cash provided by (used in) operating activities |
|---|---|---|---|---|
| FY2019 | 3,615,960 | (2,602,241) | (11.44) | (105,702) |
| FY2020 | 2,364,681 | (1,752,857) | (5.61) | (1,378,899) |
| FY2021 | 3,208,323 | (1,062,144) | (3.17) | (101,721) |
| FY2022 | 4,095,135 | (1,584,511) | (4.47) | (237,285) |
| FY2023 | 4,403,589 | (340,320) | (0.88) | (98,244) |
| FY2024 | 5,786,016 | 22,784 | 0.06 | 849,737 |
| FY2025 | 6,316,261 | 2,844,008 | 6.81 | 1,168,438 |
Source: consolidated statements across filings; older years from the standardized feed [10] [1] [11] [4]. Click any linked figure to open the filing page with the row highlighted.
Operating KPIs
| KPI | FY2021 | FY2022 | FY2023 | FY2024 | FY2025 |
|---|---|---|---|---|---|
| Gross Bookings | — | 12,057,300 | 13,775,200 | 16,099,400 | 18,507,000 |
| Rides | — | 598,500,000 | 709,000,000 | 828,300,000 | 945,500,000 |
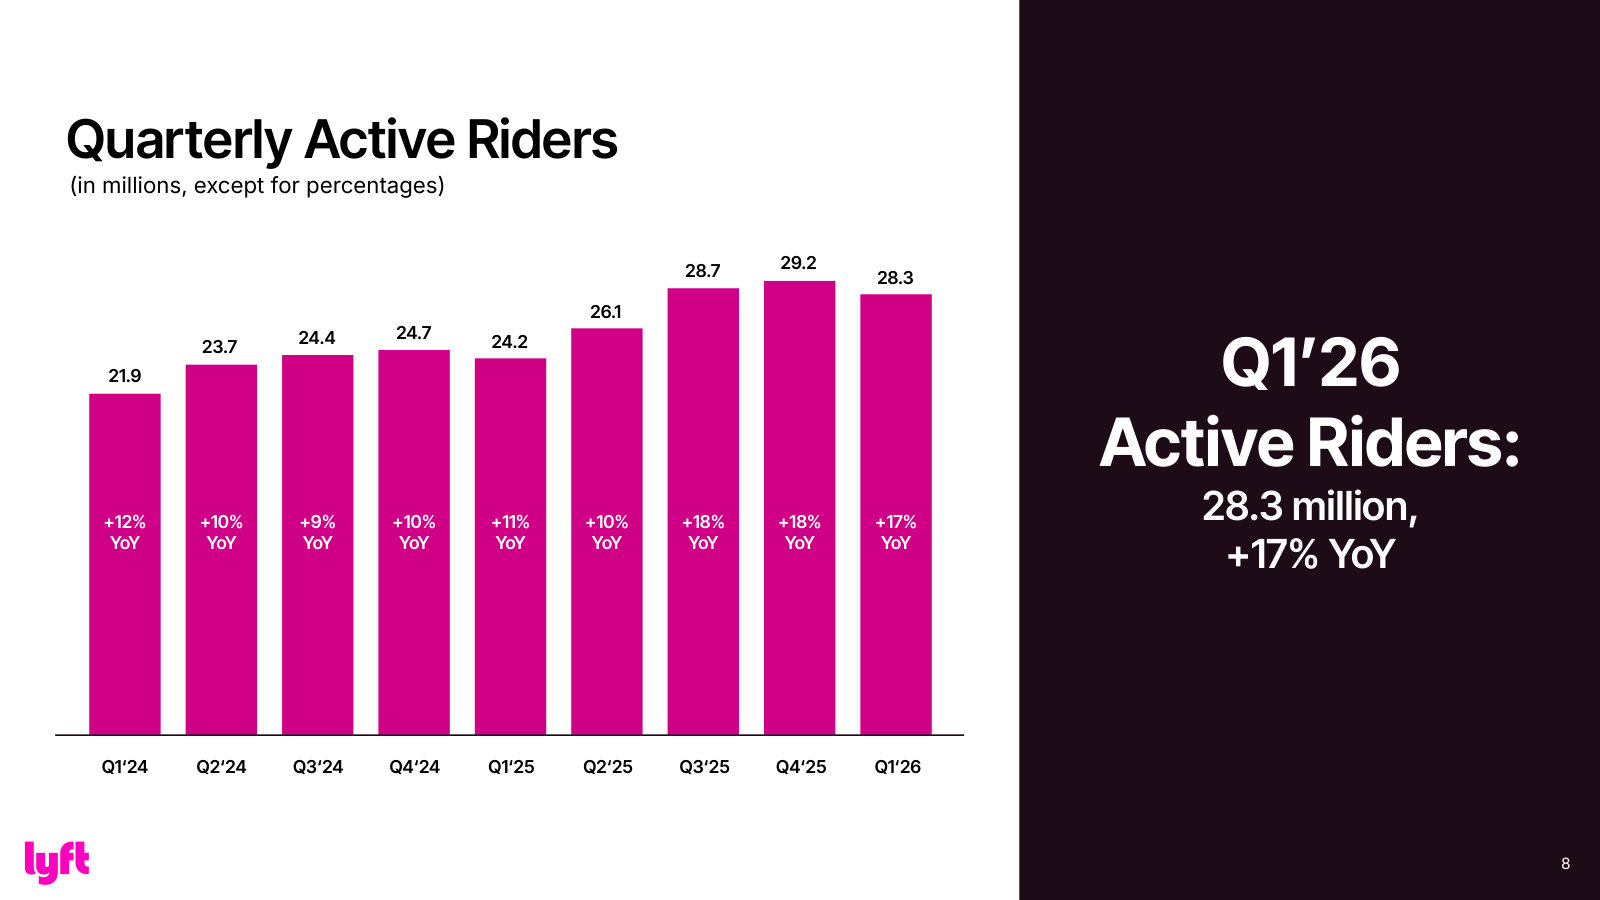
| Active Riders (Q4) | — | 20,400,000 | 22,400,000 | 24,700,000 | 29,200,000 |
| Adjusted EBITDA | — | (416,500) | 222,400 | 382,400 | 528,800 |
Source: company-reported operating metrics [12] [16]. Click any linked figure to open the filing page with the row highlighted.
Analyst Consensus
Mean target
Median target
High target
Low target
Street ratings: 10 strong buy, 4 buy, 28 hold, 1 sell. Consensus: Buy.
Estimate source: S&P Capital IQ (CapIQ) consensus, as of 2026-07-24. Estimate figures are S&P Capital IQ consensus (vendor data — no filing page links). EPS and net income use the normalized (adjusted) consensus where the street reports it. Line-item analyst models (segments, drivers, KPIs) are in the Visible Alpha tab.
Traceability
313 of 313 figures on this page (100%) link to the filing page where they are printed — click a linked figure to open the source PDF at that page with the row highlighted. Unlinked figures come from standardized data feeds or pre-filing years.
All figures are in US$ thousands, as printed on the filings' consolidated statements ('in thousands, except per-share data'). Lyft's fiscal year ends December 31.
Revenue is Total revenue = Revenue from contracts with customers (ASC 606) + Rental revenue (ASC 842). The standardized data feed captured only the ASC 606 component; the filed audited Total revenue line is used for every year (see discrepancies).
FY2025 net income of $2.844bn is driven by a $2.9bn income-tax benefit from the release of the deferred-tax-asset valuation allowance (deferred tax assets on the balance sheet rose to $2.906bn); pre-tax result was a $53m loss.
FY2021 income-statement and balance-sheet columns are the restated comparatives from the FY2022 Form 10-K, not the as-originally-filed FY2021 10-K (see discrepancies).
FY2019–FY2020 long-term figures are comparative columns of the FY2021 Form 10-K; FY2021–FY2022 from the FY2022 10-K; FY2023–FY2025 from the FY2025 10-K.
Lyft operates as a single reportable segment; the revenue breakdown shown is the company's own ASC 606 vs. ASC 842 disaggregation (Note 3). Revenue is ~96–99% United States (International $256.0m of $6,316.3m in FY2025).
KPI values: Gross Bookings and Adjusted EBITDA are money in US$ thousands (page anchors are printed in $ millions); Rides and Active Riders are absolute counts (page anchors are printed in millions). Active Riders is the fourth-quarter figure.
Quarterly Q4 FY25 income-statement and all derived quarterly cash-flow cells are computed from printed year-to-date / full-year statements (see the quarterly statement notes); every such cell reconciles exactly to the two printed figures.
3 figure(s) differed between the data feed and the filing; the filing value is shown (see the run's metrics/metrics_tab.json for the audit trail).
Lyft, Inc.'s management explains the business in its own materials. The slides below do the most of that work, pulled from the documents preserved in Sources. Each source link opens the complete presentation at that slide in a new tab.
Q1 2026 Earnings — Q1 2026
The latest earnings deck and the fullest current snapshot: what the business does, how it grows, and where the numbers stand. · Open the full document →

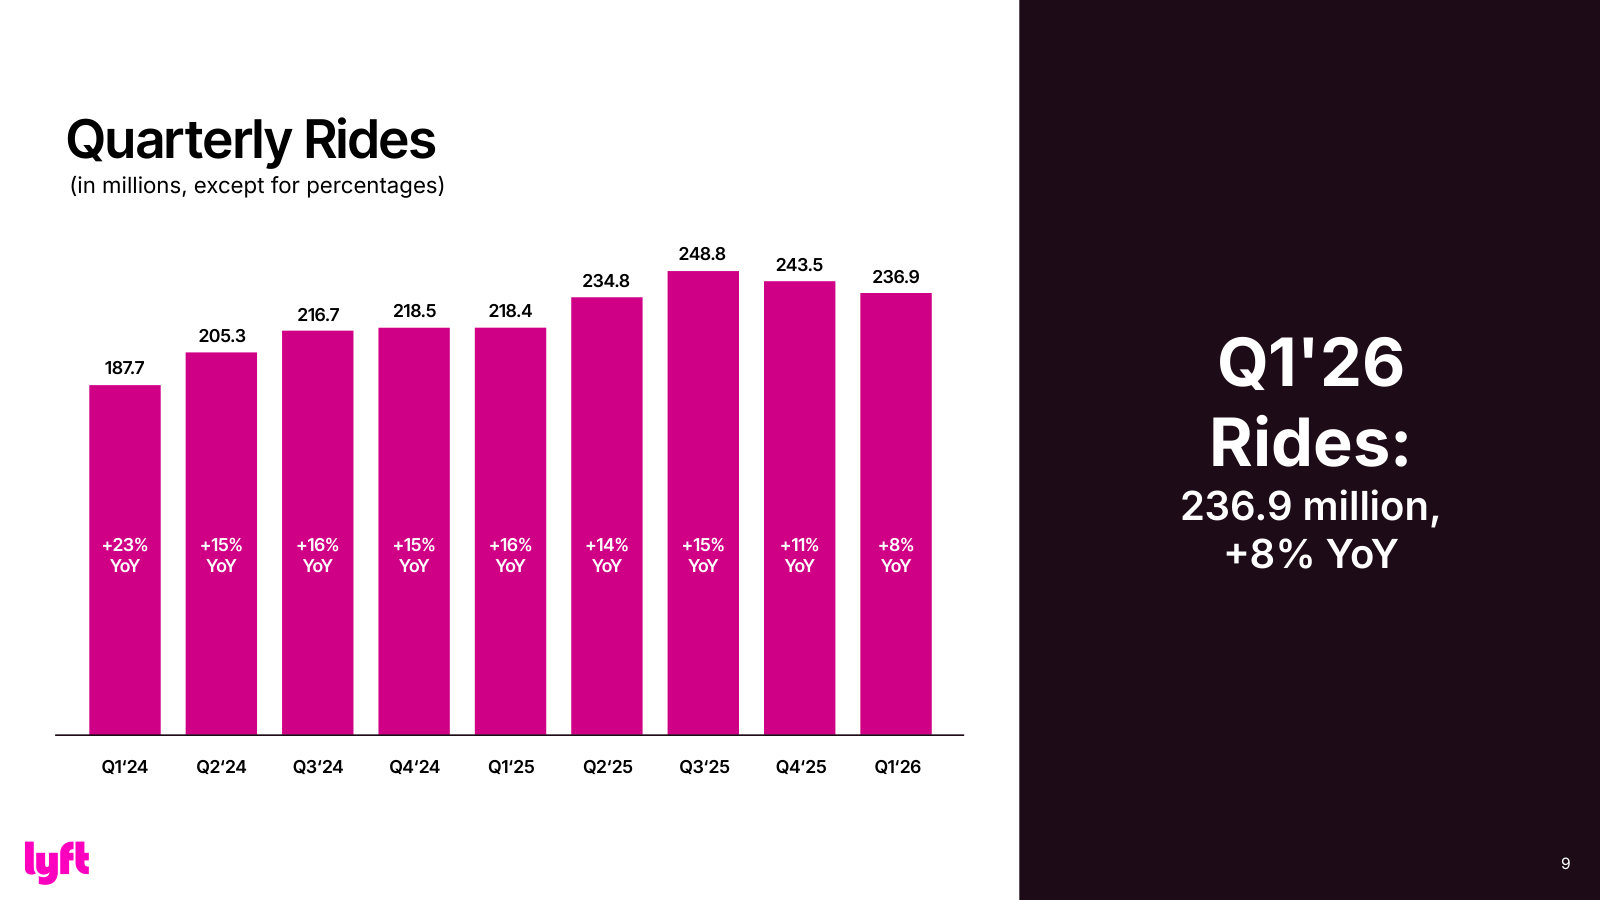
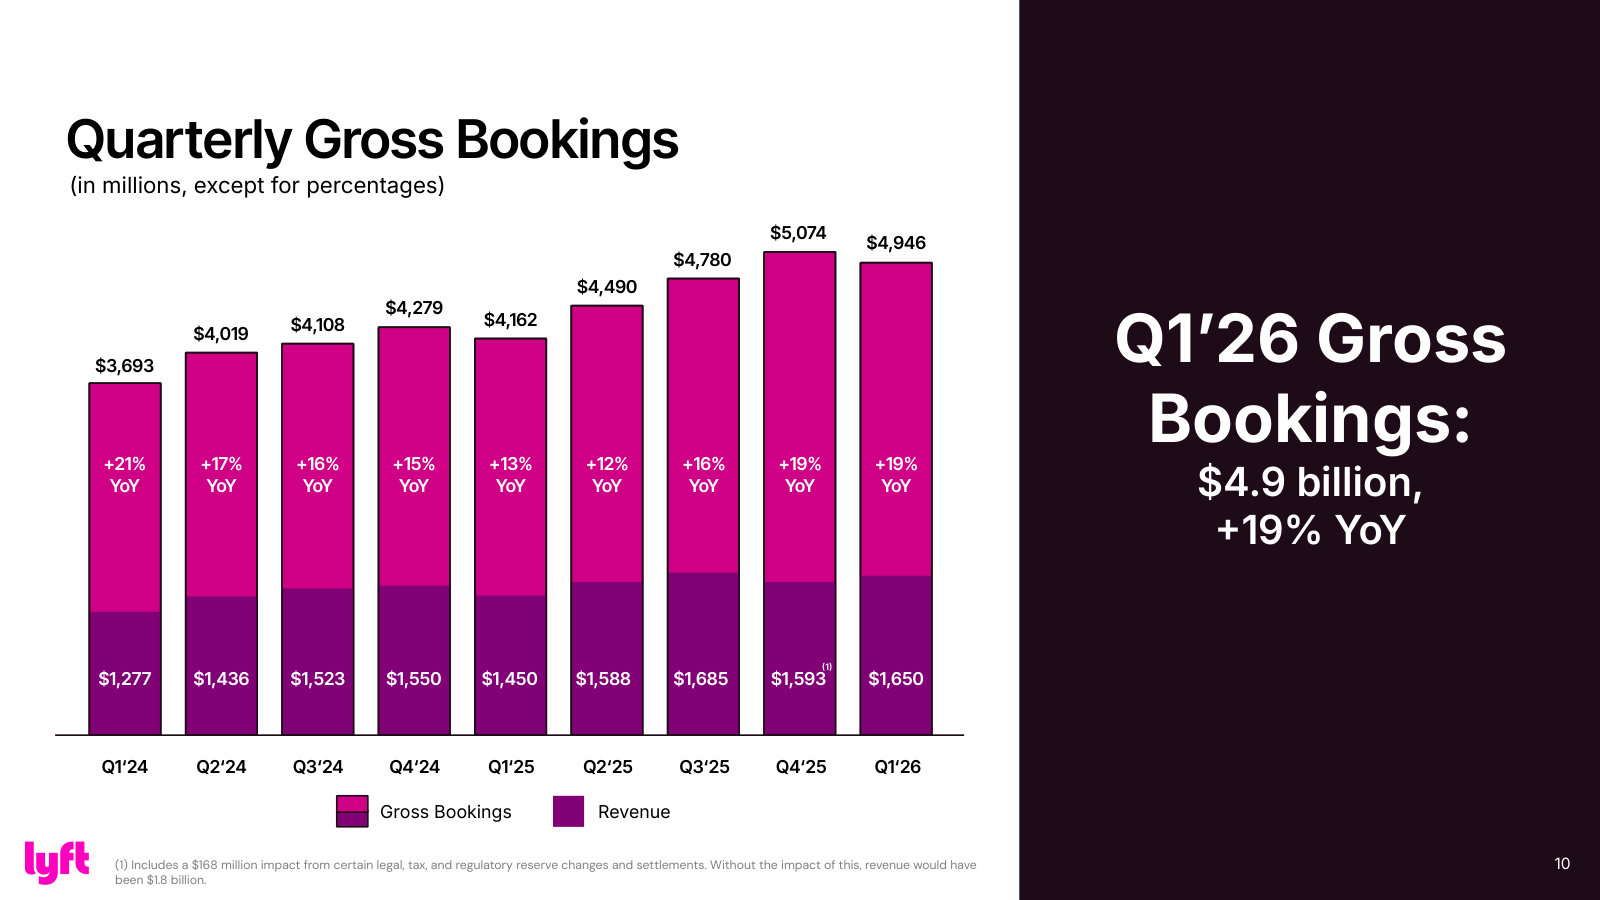
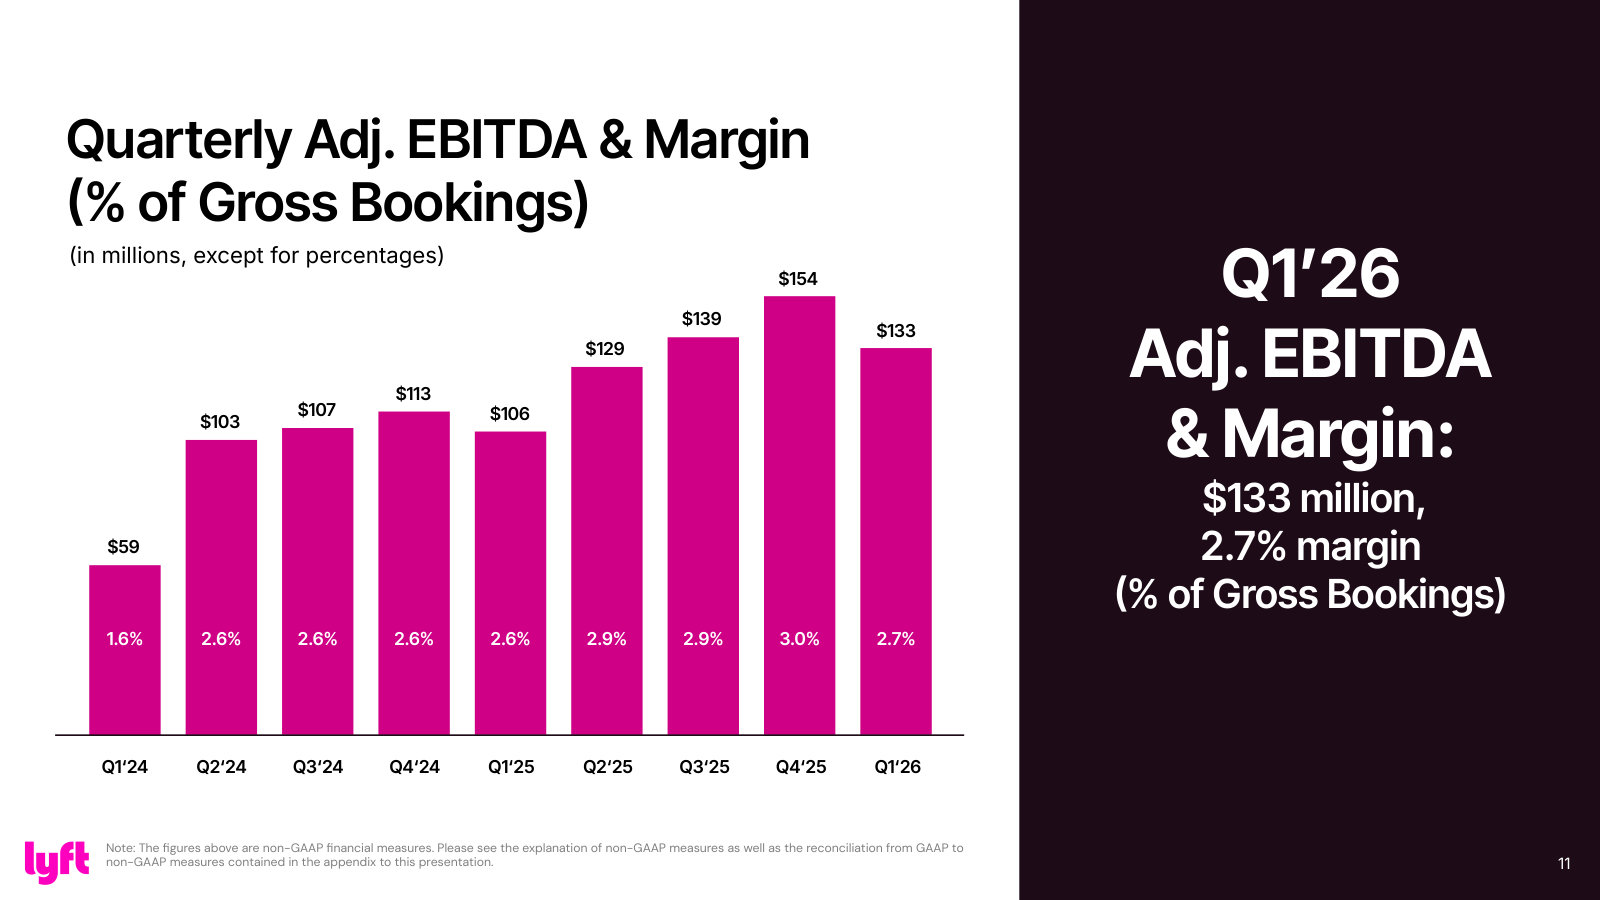
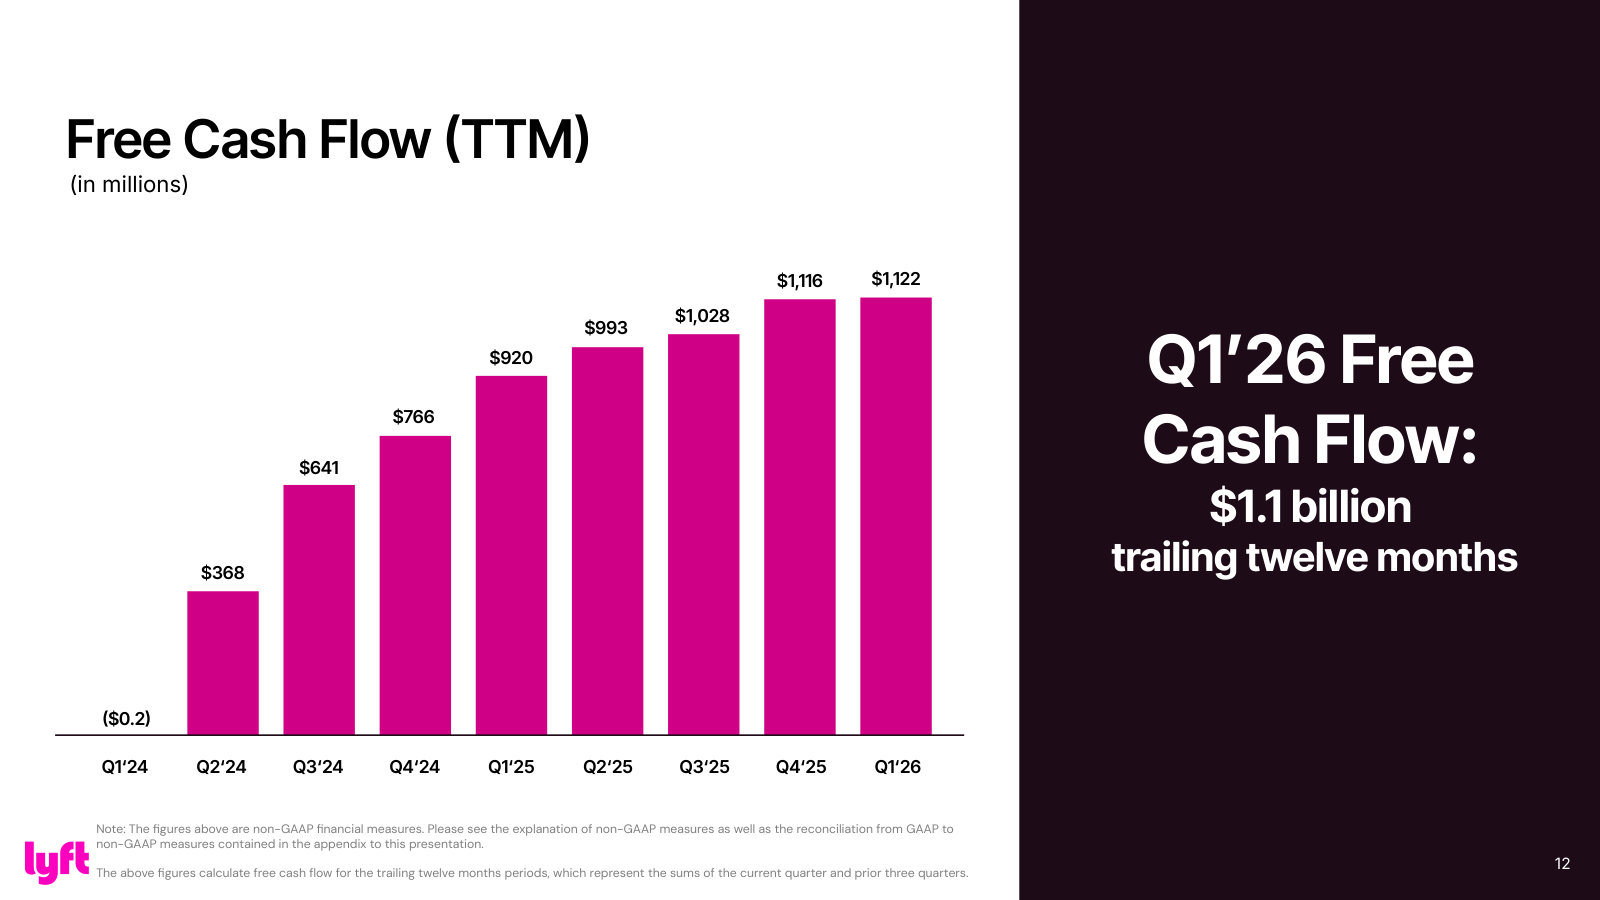
Q4 & Fiscal 2025 Earnings — Q4 & FY2025
The full-year deck: annual framing, the product portfolio, the AV value-chain map, and the multi-year targets management is measured against. · Open the full document →
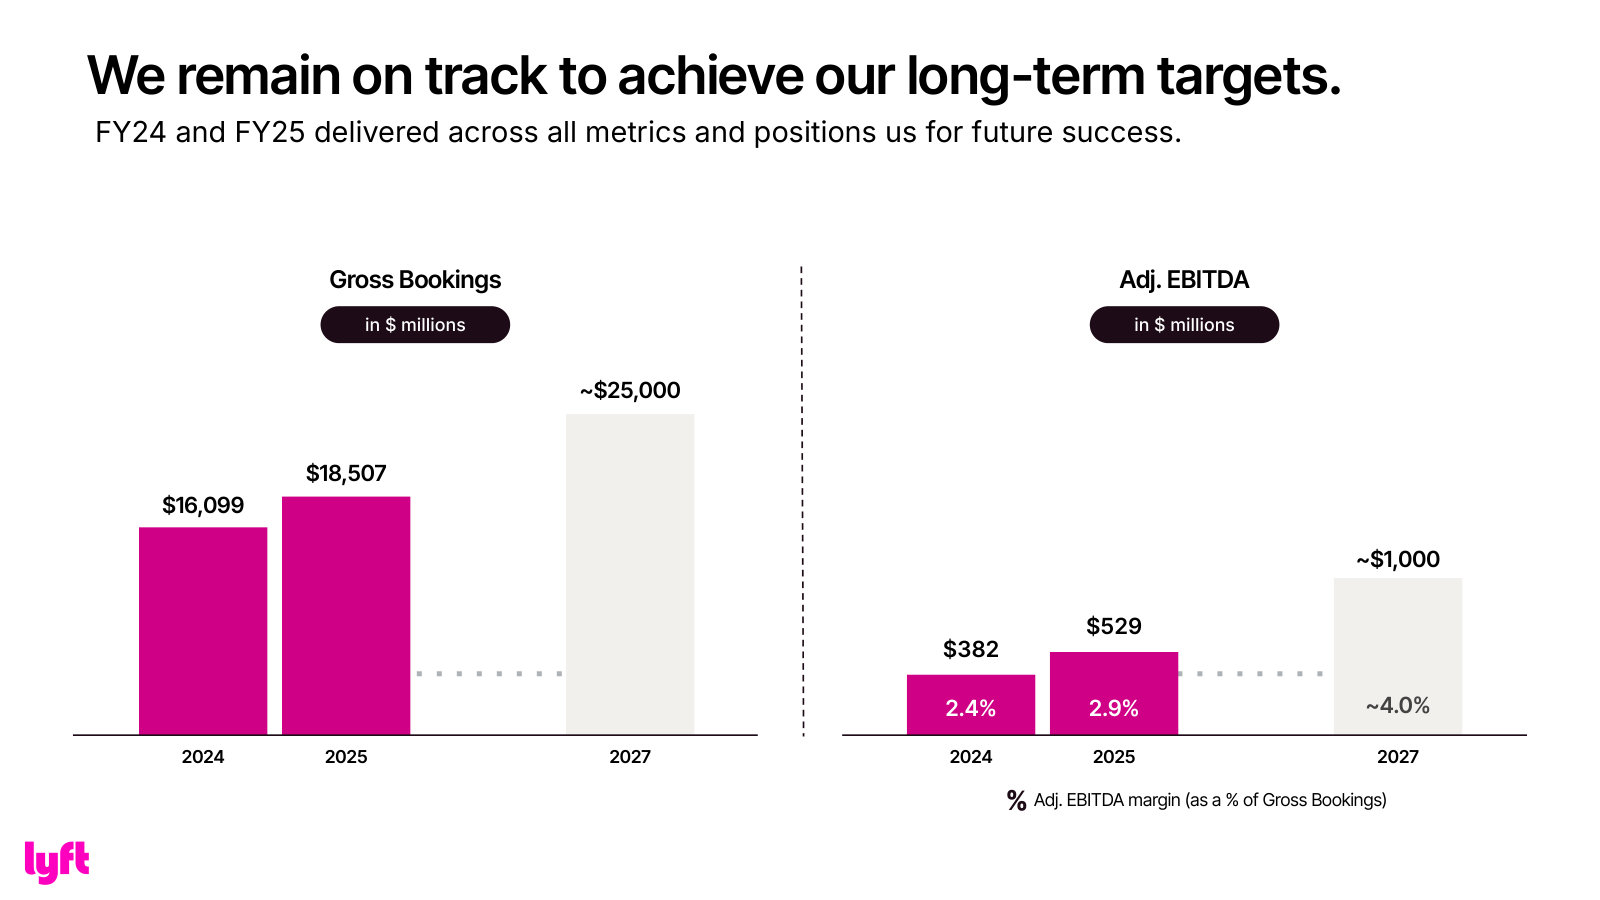
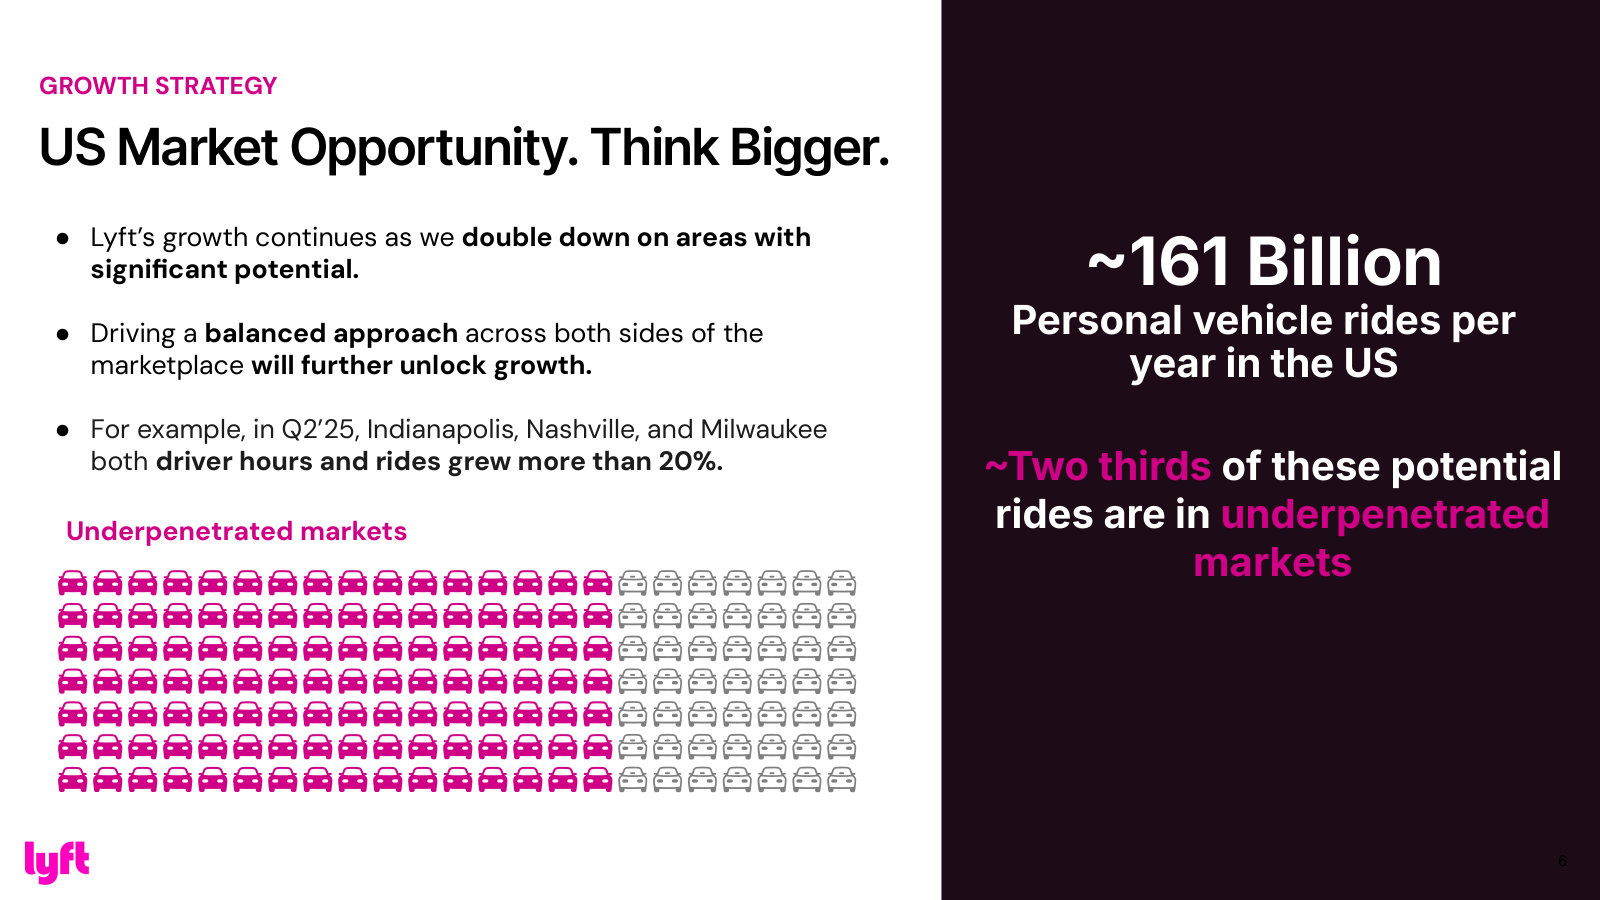
Q2 2025 Earnings — Q2 2025
Carries two slides the other decks don't: the US market-size framing and the incentive-per-ride trend behind margin expansion. · Open the full document →
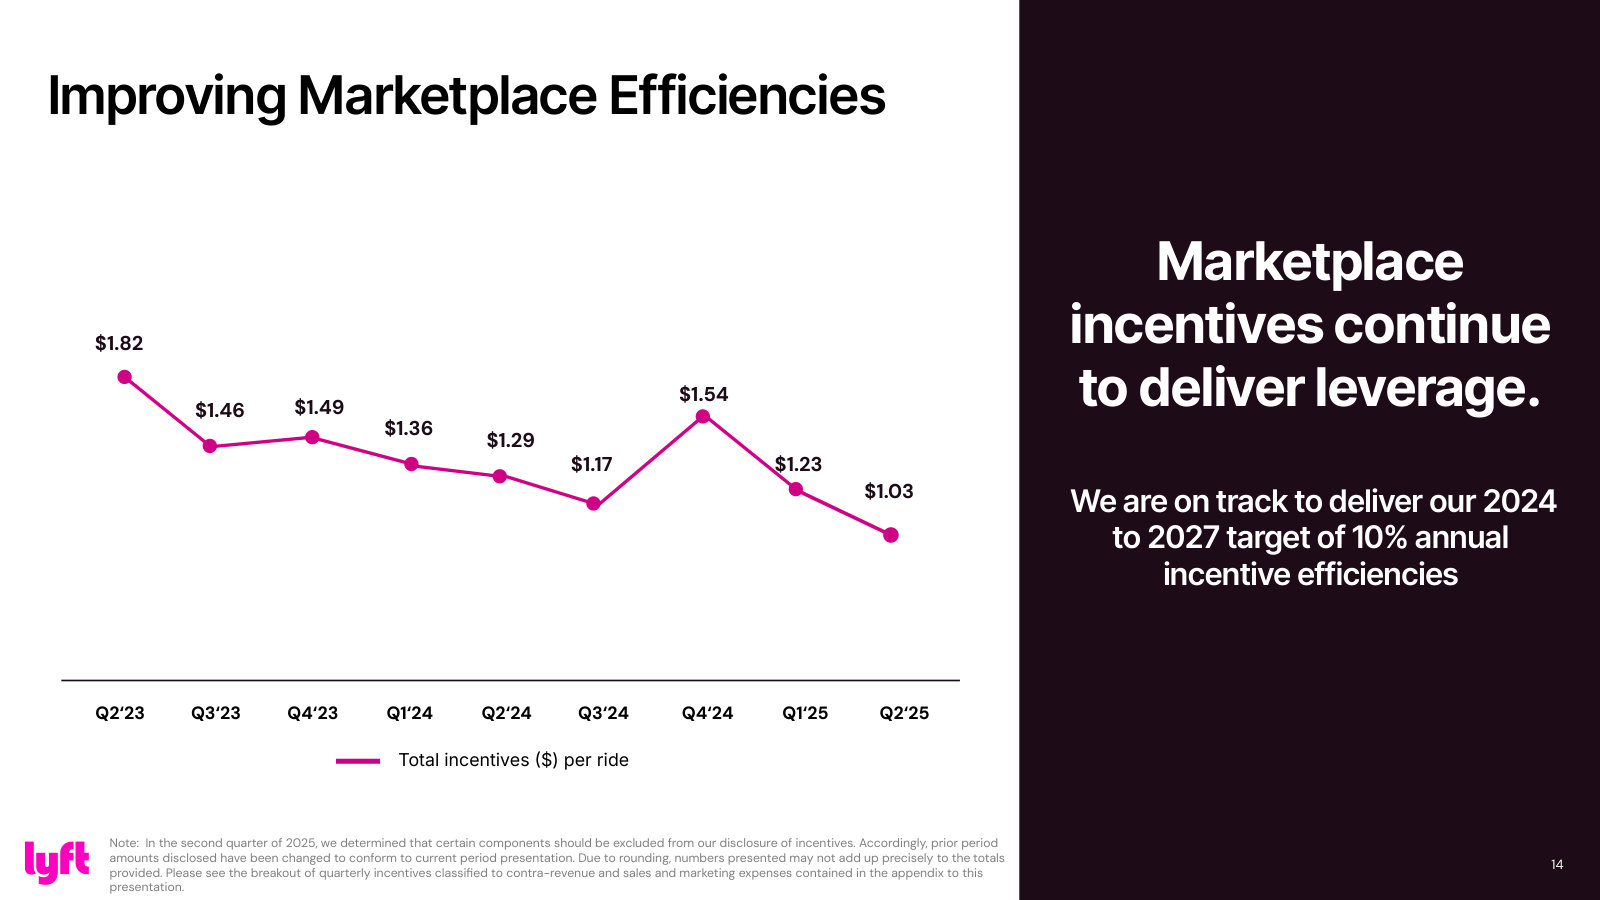
More from management
Q3 2025 Earnings — Q3 2025 · 32 pages · The quarter Lyft first crossed $1B TTM free cash flow, plus a new-geographies map and an FY25–27 outlook slide. · Open →
Q4 & Fiscal 2024 Earnings — Q4 & FY2024 · 31 pages · The prior full-year deck — the FY2024 baseline the FY2025 and 2027 targets are measured against. · Open →
Q4 & Fiscal 2023 Earnings — Q4 & FY2023 · 32 pages · The earliest full-year deck in the set, marking the turn toward positive free cash flow — a useful starting point for the trend. · Open →
Lyft, Inc.'s management answers for the business every quarter. These are the exchanges that explain it best — verbatim, from the call transcripts preserved in Sources. Each link opens the full transcript at that page in a new tab.
Q1 FY2026 Earnings Call — Q1 FY2026
The current playbook in one call: a partnerships-driven acquisition engine, an AV rollout moving city by city, and premium-mode mix lifting margin. · Open the full transcript →
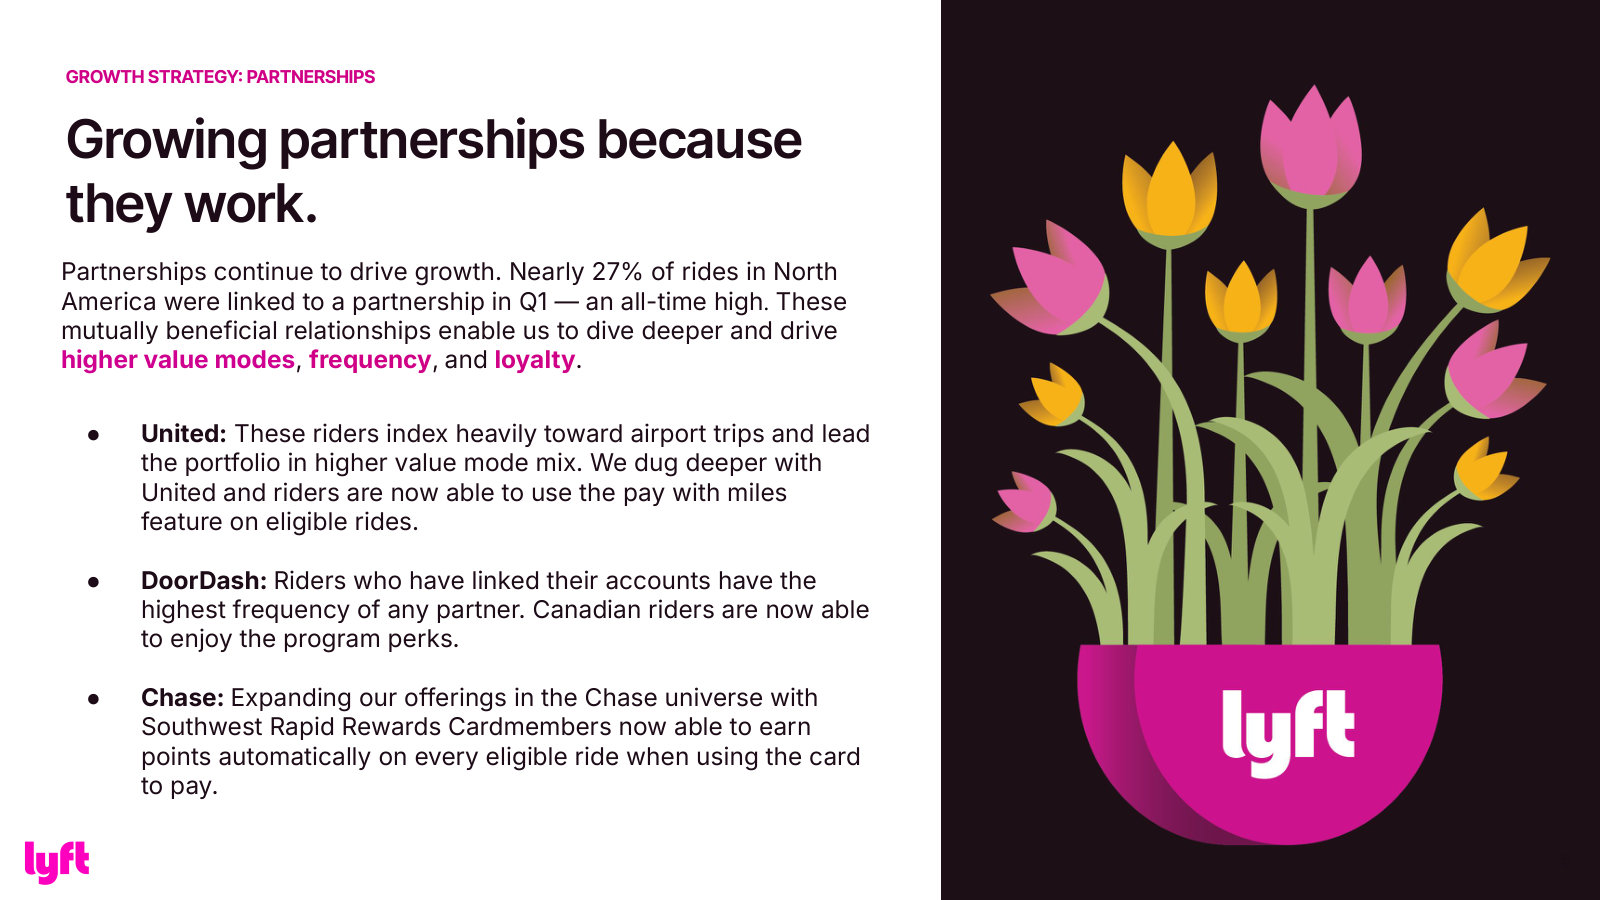
How partnerships work as a customer-acquisition engine — 27% of ride requests, tuned to each partner's user base.
David Risher (CEO); Eric Sheridan (Goldman Sachs): So to your question, we got a record number of partnershiptagged ride requests this quarter, so about 27%. And that's a big deal. I think when we first started talking about this, we were at 20%, then 22%, then 25% and now 27%. Why? Two reasons. Number one, we partner with great organizations that have huge TAMs. […] For example, DoorDash customers tend to be very heavy users. And you can understand this: people eat three times a day, and they tend to take rides relatively more often than others. […] If you look at United Airlines, United tends to be more business customers. We out-index in some of United's big hubs, Chicago being a good example where we had great growth this past year. They tend to be airport rides, not surprisingly, which means higher bookings per ride, which tends to mean higher profits.
p. 2 · Read in context →
The honest answer to slowing U.S. rides: growth is now in low-scale cities, while the largest, oldest markets flatten.
David Risher (CEO); Nikhil Devnani (Bernstein): North America is a huge region— super diverse, a lot of geographies and segments. What we have seen is in Canada for sure, and also in low-scale markets that we've been talking about for six or seven quarters, that's where we are seeing outsized growth. […] Low-scale markets are maybe the Milwaukees or the Pittsburghs—second and third-tier cities or even more rural areas where there's a huge amount of TAM left and it's underpenetrated. In some of the largest cities where rideshare has been active the longest, the industry on average is seeing slightly lower rates of growth or at least did see that this past quarter.
p. 3 · Read in context →
Why gross bookings outgrow rides — premium modes up 35%, plus FREENOW, ads and luxury that aren't always ride-attached.
Erin Brewer (CFO); John Blackledge (TD Cowen): Part of what you're seeing is the continuation of a shift toward higher-value modes—up over 35% year-over-year in the first quarter. Adding the FREENOW business, which carries a higher average gross bookings per ride, is also helpful. Separately, we continue to diversify the things that add to our gross bookings where there may not be a ride attached— things like ads and luxury.
p. 5 · Read in context →
The AV rollout, city by city: Waymo in Nashville on Lyft's fleet-ops backbone, Baidu in London, a city-level deal in Hamburg.
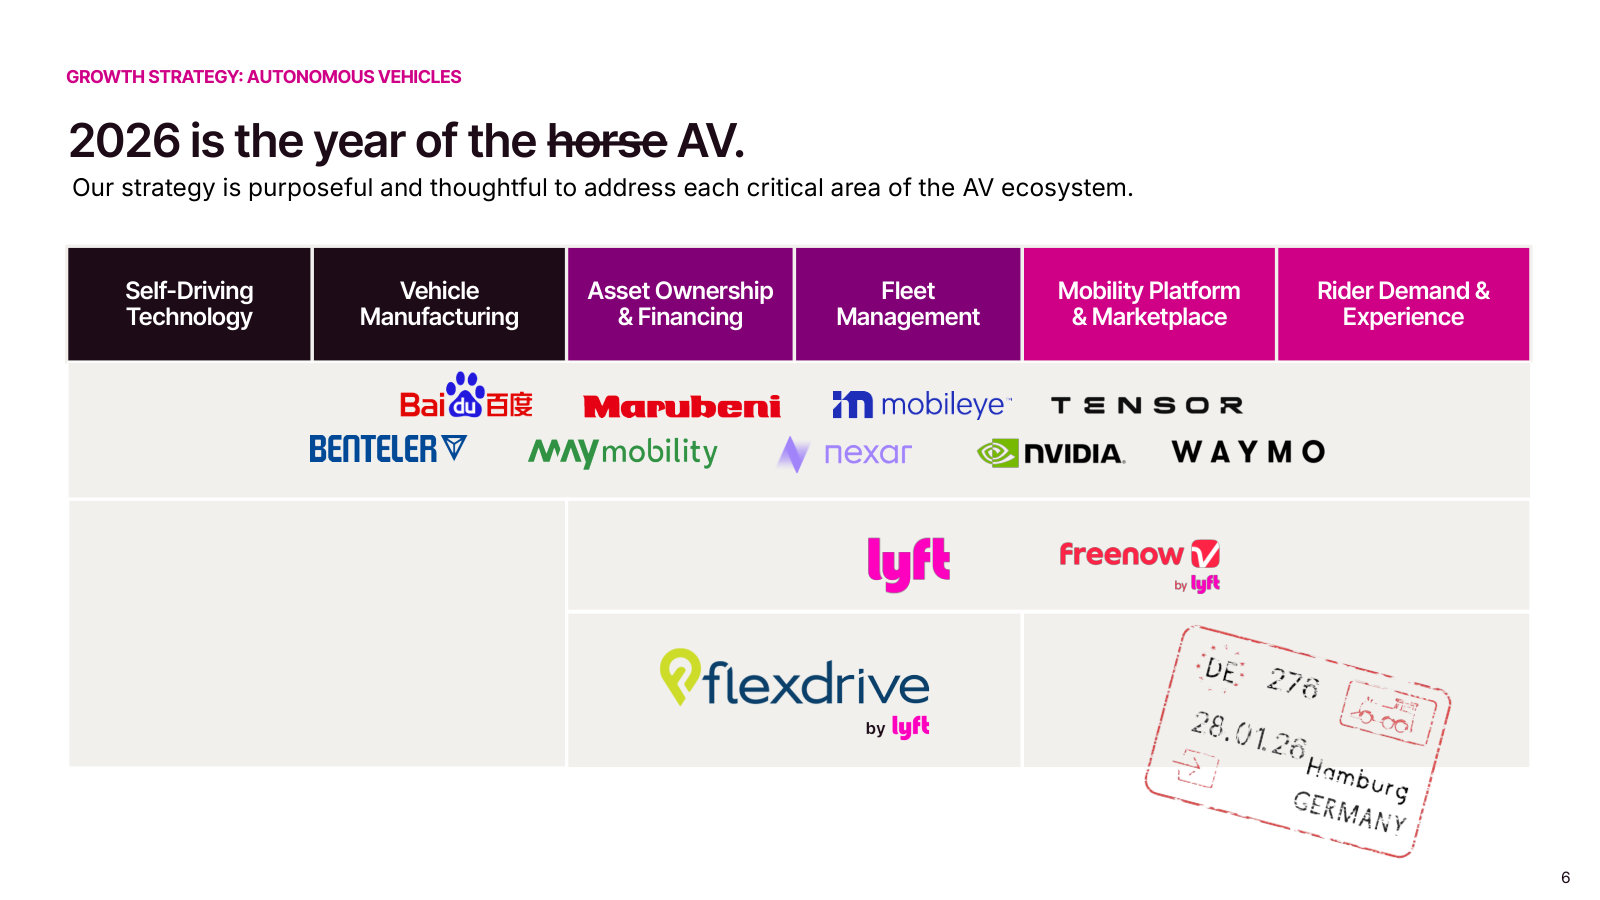
David Risher (CEO); Rohit Kulkarni (ROTH Capital): On AVs across the cities: Nashville is exciting—Waymo is on the road now. Later this summer, we start to take over operations of that fleet. We'll open an 80,000-square-foot center, and you'll be able to order a Waymo on the Lyft app in our hybrid marketplace there. It's going great. We've had extensive experience operating fleets through our FlexDrive subsidiary—about 50,000 cars that have driven billions of miles—giving us deep expertise in maintenance and availability. […] In London, our partner is Baidu. Baidu is highly advanced: their RT6 cars are rolling out and mapping is underway. It takes time with regulators and local street physics—narrow two-way streets and signaling dynamics—so London is a bit earlier in the process but on track. […] Hamburg is a different setup: we've established a partnership at the city level to be the AV provider there; we haven't given all the details today.
p. 8 · Read in context →
Q4 & Full-Year 2025 Earnings Call — Q4 FY2025
The full-year framing: a market Lyft calls ~5% penetrated, the AV hybrid-network cost thesis, guidance discipline, and the one-time item behind reported take rate. · Open the full transcript →
The whole strategy in one arithmetic: a ~300bn-ride TAM, ~5% penetrated, so focus on the 95% (customers), not the 5% (competitors).
David Risher (CEO); Eric Sheridan (Goldman Sachs): Customer obsession is what drives our profitable growth. And I think I feel more strongly about that than ever, and let me use that as a way to kind of pivot to the next thing. If you think of our addressable market for a second, think of the 160 billion rides in the US and the same number in Europe because, of course, now we're a European operator, very important. 300 billion rides our addressable market. Let's say, let's cut that in third, just to be super conservative, call it 100 billion, just to make the math super easy. And remember that we do maybe a billion in our competition, you in total does maybe three or four billion. So maybe that's five billion out of the 100. Okay. So that's 5% penetrated, which shows there is an enormous amount of headroom. […] What it leads you to do is to focus on your customers, not your competitors. Because if you focus on your competitors, you're just fighting over the 5%, not the 95%.
p. 2 · Read in context →
Guidance philosophy: run to top line and bottom line, and don't chase competitors' in-quarter promotional 'gimmickry.'
David Risher (CEO); John Blackledge (TD Cowen): We are a very disciplined operator. And the reason I say this is because we nerd you know, you when you identify as discipline, it means you have to decide what you're going to focus on. And we have decided, if quarter after quarter, and I think you've seen this, that we're going to focus on our top line and our bottom line. That's how we're going to run this business for our shareholders. […] It means that when you see some, you know, kind of promotional, you know, gimmickry or whatever it is within a quarter, you sort of look at it and say, well, okay, whatever. It's going to happen. But meanwhile, what we're really focused on is making sure we can deliver on the top and the bottom, in a customer-obsessed way. You don't get jumped by the marginal ride that's maybe not profitable
p. 5 · Read in context →
Answering the take-rate question head-on: a $210m one-time reserve change, $168m of it against revenue, distorted reported revenue margin.
Erin Brewer (CFO); Michael Morton (MoffettNathanson): In our supplemental tables, we provided an EBITDA bridge. And in that bridge, it highlights a one-time impact of totaling about $210 million under the category of certain legal tax and regulatory reserve changes. It's important to note that a $168 million of that $210 million impacted revenue. So without that, our revenue would be closer to $1.8 billion, and you'd get a revenue margin that's, you know, pretty close to what we saw in the previous quarter.
p. 10 · Read in context →
Q1 FY2024 Earnings Call — Q1 FY2024
The turnaround made concrete: four straight profitable quarters and first free cash flow, the marketplace mechanics behind it, and the AV debate first joined. · Open the full transcript →
The inflection stated plainly: a rebuilt cost base, ~$260m of adjusted EBITDA over four quarters, and the first positive free cash flow.
Erin Brewer (CFO): We've established a strong foundation for profitable growth. Our cost structure is in the right place. We've delivered four quarters of positive adjusted EBITDA totaling nearly $260 million. We've better aligned our financial disclosures with our strategic priorities, and we've begun to generate positive free cash flow.
p. 2 · Read in context →
How the marketplace pays off: rides up 23% on lower Primetime, and driver preference plus demand-visibility make each incentive dollar go further.
Erin Brewer (CFO): Gross bookings were approximately $3.7 billion, up 21% year-over-year. This reflects strong rides growth, partially offset by lower total prices year-over-year, reflecting lower levels of Primetime given the significant improvements in the health of our marketplace. […] In our business, the combination of increasing driver preference and increasing drivers' visibility into rider demand is incredibly valuable. It means we can be more targeted and efficient in how incentive dollars are spent, even as drivers earn more.
p. 3 · Read in context →
Competing on product, not just price — Women+ Connect and loyalty partnerships (Chase, Delta) at ~20% of rides.
David Risher (CEO); Eric Sheridan (Goldman Sachs): We are also innovating new segments, such as Women+ Connect, which has gained traction. For instance, one story shared was about a woman who can now finally take a nap during her Lyft rides, a luxury more commonly enjoyed by men. In the past few months, we've seen a 24-26% rise in new Women+ Connect drivers, indicating a growing interest among women in our platform. […] Partnerships play a vital role in our strategy, currently contributing to around 20% of our rides, including collaborations with Chase, where Sapphire members can earn 10x points, and Delta, where we're among only two partners enabling Delta SkyMiles accumulation.
p. 5 · Read in context →
Q2 FY2023 Earnings Call — Q2 FY2023
David Risher's first full call as CEO — where the 'customer obsession' turnaround thesis, driver-preference push, and the cost reset were first laid out. · Open the full transcript →
The mechanics of the fix: driver preference up 25% vs Uber, driver hours up 35%, and Wait & Save giving riders a reason to shop inside Lyft's app.
David Risher (CEO): Among the drivers who use both Lyft and Uber, we have seen a 25% increase in preference for Lyft since Q4 of last year. And in Q2, the number of drivers using Lyft grew by more than 20% compared to Q2 last year, and driver hours increased even faster, up by more than 35%. […] Over on the rider side, we continue to see growth, and in particular, with Wait and Save, which is our most affordable rideshare option. So Wait and Save offers riders a way to save money when they aren't in a big hurry. This lets riders price shop within our app instead of going to the other guy. In Q2, Wait and Save trips grew by more than 40% year on year on year and reached new all-time records
p. 5 · Read in context →
The thesis, stated: customer obsession over competitor-watching, and a two-strong-player market is good for riders and drivers.
David Risher (CEO): So in summary, you all, we are executing well on our strategy of being customer obsessed, and the results suggest this strategy is working. Riders and drivers want and value choice. It's in everyone's best interest for there to be two strong players competing for their business.
By obsessing over our customers, we can continue to differentiate ourselves and grow this market and we have an incredible team that's focused on these objectives.
p. 6 · Read in context →
The cost reset in numbers: contribution margin 42% (+10pts), opex down 24% year-over-year to 40% of revenue from 54%.
Erin Brewer (CFO): Contribution margin was 42%, in line with guidance. Relative to Q2 of last year, contribution margin increased by 10 percentage points. […] In absolute dollars, contribution in Q2 '23 was $426 million, up 35% year over year. Operating expenses were $410 million, down 24% year over year, due primarily to our cost restructuring initiatives. As a percentage of revenue, Q2 operating expenses were 40%, compared with 54% in Q2 of the prior year.
p. 8 · Read in context →
Capital-allocation instinct on a low-margin product: 'do the right thing, then do things right' — offer Wait & Save first, optimize margin after.
David Risher (CEO): First, do the right thing and then do things right. So the right thing is for us to offer an option in our app that allows our riders to choose to pay money when they want to and everybody likes the deal. […] Now any portfolio is going to have some lower margin and some higher-margin products. And I expect this will be a lower-margin product forever. But there's a lot of work we're doing behind the scenes to improve the profitability of it
p. 17 · Read in context →
More calls
Q3 FY2025 Earnings Call — Q3 FY2025 · 10 pages · Progress on the Waymo/Nashville AV depot and FlexDrive fleet-ops pitch, plus the record free-cash-flow and buyback cadence. · Open →
Q2 FY2025 Earnings Call — Q2 FY2025 · 9 pages · Early read on the FREENOW acquisition and the European expansion economics that reshape the growth story. · Open →
Q4 & Full-Year 2024 Earnings Call — Q4 FY2024 · 5 pages · First full year of adjusted profit and the 2027 Investor-Day targets ($25bn gross bookings, 4% margin, >$1bn FCF) recapped against results. · Open →
Q3 FY2024 Earnings Call — Q3 FY2024 · 12 pages · Lyft Media build-out, Price Lock, and the partnership pipeline as new growth and margin levers. · Open →
Q2 FY2024 Earnings Call — Q2 FY2024 · 13 pages · The first quarter of positive GAAP net income, with Price Lock and the DoorDash partnership as the headline product moves. · Open →
Q4 & Full-Year 2023 Earnings Call — Q4 FY2023 · 41 pages · The full-year turnaround scorecard for 2023 — and the call marred by the widely-covered adjusted-EBITDA-margin guidance typo. · Open →
Q3 FY2023 Earnings Call — Q3 FY2023 · 38 pages · Wait & Save at scale and continued driver-preference gains as the customer-obsession playbook compounds. · Open →
Q1 FY2023 Earnings Call — Q1 FY2023 · 29 pages · The leadership handoff — co-founders Logan Green and John Zimmer step back and David Risher takes over day-to-day. · Open →
Lyft, Inc.'s annual reports contain management's most considered account of the business. These are the sections, passages and visual pages worth opening in the originals preserved in Sources.
Lyft, Inc. — FY2025 Annual Report (Form 10-K) — FY2025
The latest 10-K and a genuine inflection: Lyft's second straight profitable year, a $2.9bn tax-driven net income, and its first move outside North America. · Open the full document →
Item 1. Business — p. 6 · Read the full section →
The identity reset: Lyft reframes itself from a US/Canada rideshare app to a global mobility platform spanning six continents.
Opening self-description and revenue model, now recast around a global, multimodal footprint.
Lyft, Inc. (the “Company” or “Lyft”) operates as a global mobility platform offering a mix of rideshare, taxis, private hire vehicles, executive chauffeur services, car sharing, bikes and scooters. […] Substantially all of our revenue is generated from our ridesharing marketplace that connects drivers and riders. We collect service fees and commissions from drivers for their use of our ridesharing marketplace. […] In 2025, we expanded our operations beyond North America and strengthened our global footprint. We entered nine new countries and more than 180 cities through our acquisition of Intelligent Apps GmbH (d/b/a Freenow) in July 2025, a leading European multimodal app with taxi offering at its core.
p. 6 · Read in context →
The competitive set, from Uber and Bolt to the AV entrants Waymo, Zoox and Tesla.
The market for Transportation-as-a-Service (“TaaS”) networks is intensely competitive and characterized by rapid changes in technology, shifting levels of demand and frequent introductions of new services and offerings. […] Our main ridesharing competitor is Uber and our main competitors for app-based intermediation services for taxi and private hire vehicles are Uber and Bolt, though we also compete with other TNCs, taxi cab and livery companies as well as traditional automotive manufacturers and technology companies.
p. 10 · Read in context →
Item 1A. Risk Factors — We may not be able to achieve or maintain profitability in the future — p. 21 · Read the full section →
Management's own reminder that two years of GAAP net income sit atop a decade of losses and could reverse.
On the fragility of Lyft's newfound profitability.
We achieved net income, on a GAAP basis, in the years ended December 31, 2024 and 2025, however, we incurred net losses every other year since our inception, and we may not be able to achieve or maintain GAAP profitability. We expect that our financial performance, including our net income and Adjusted EBITDA, will continue to fluctuate in future periods. We can provide no assurances that we will achieve or maintain profitability in the future, on a quarterly or annual basis.
p. 21 · Read in context →
Item 1A. Risk Factors — Our actual losses may exceed our insurance reserves — p. 29 · Read the full section →
Insurance is Lyft's single largest cost; reserves rest on actuarial guesses that rising auto-injury costs keep pressuring.
Item 1A. Risk Factors — Challenges to contractor classification of drivers — p. 67 · Read the full section →
The existential gig-economy question, now widened to Europe by the Freenow and TBR acquisitions.
Item 7. MD&A — Recent Developments — p. 95 · Read the full section →
The year in one screen: 15% Gross Bookings growth, a $2.9bn tax-driven net income, and two acquisitions that took Lyft global.
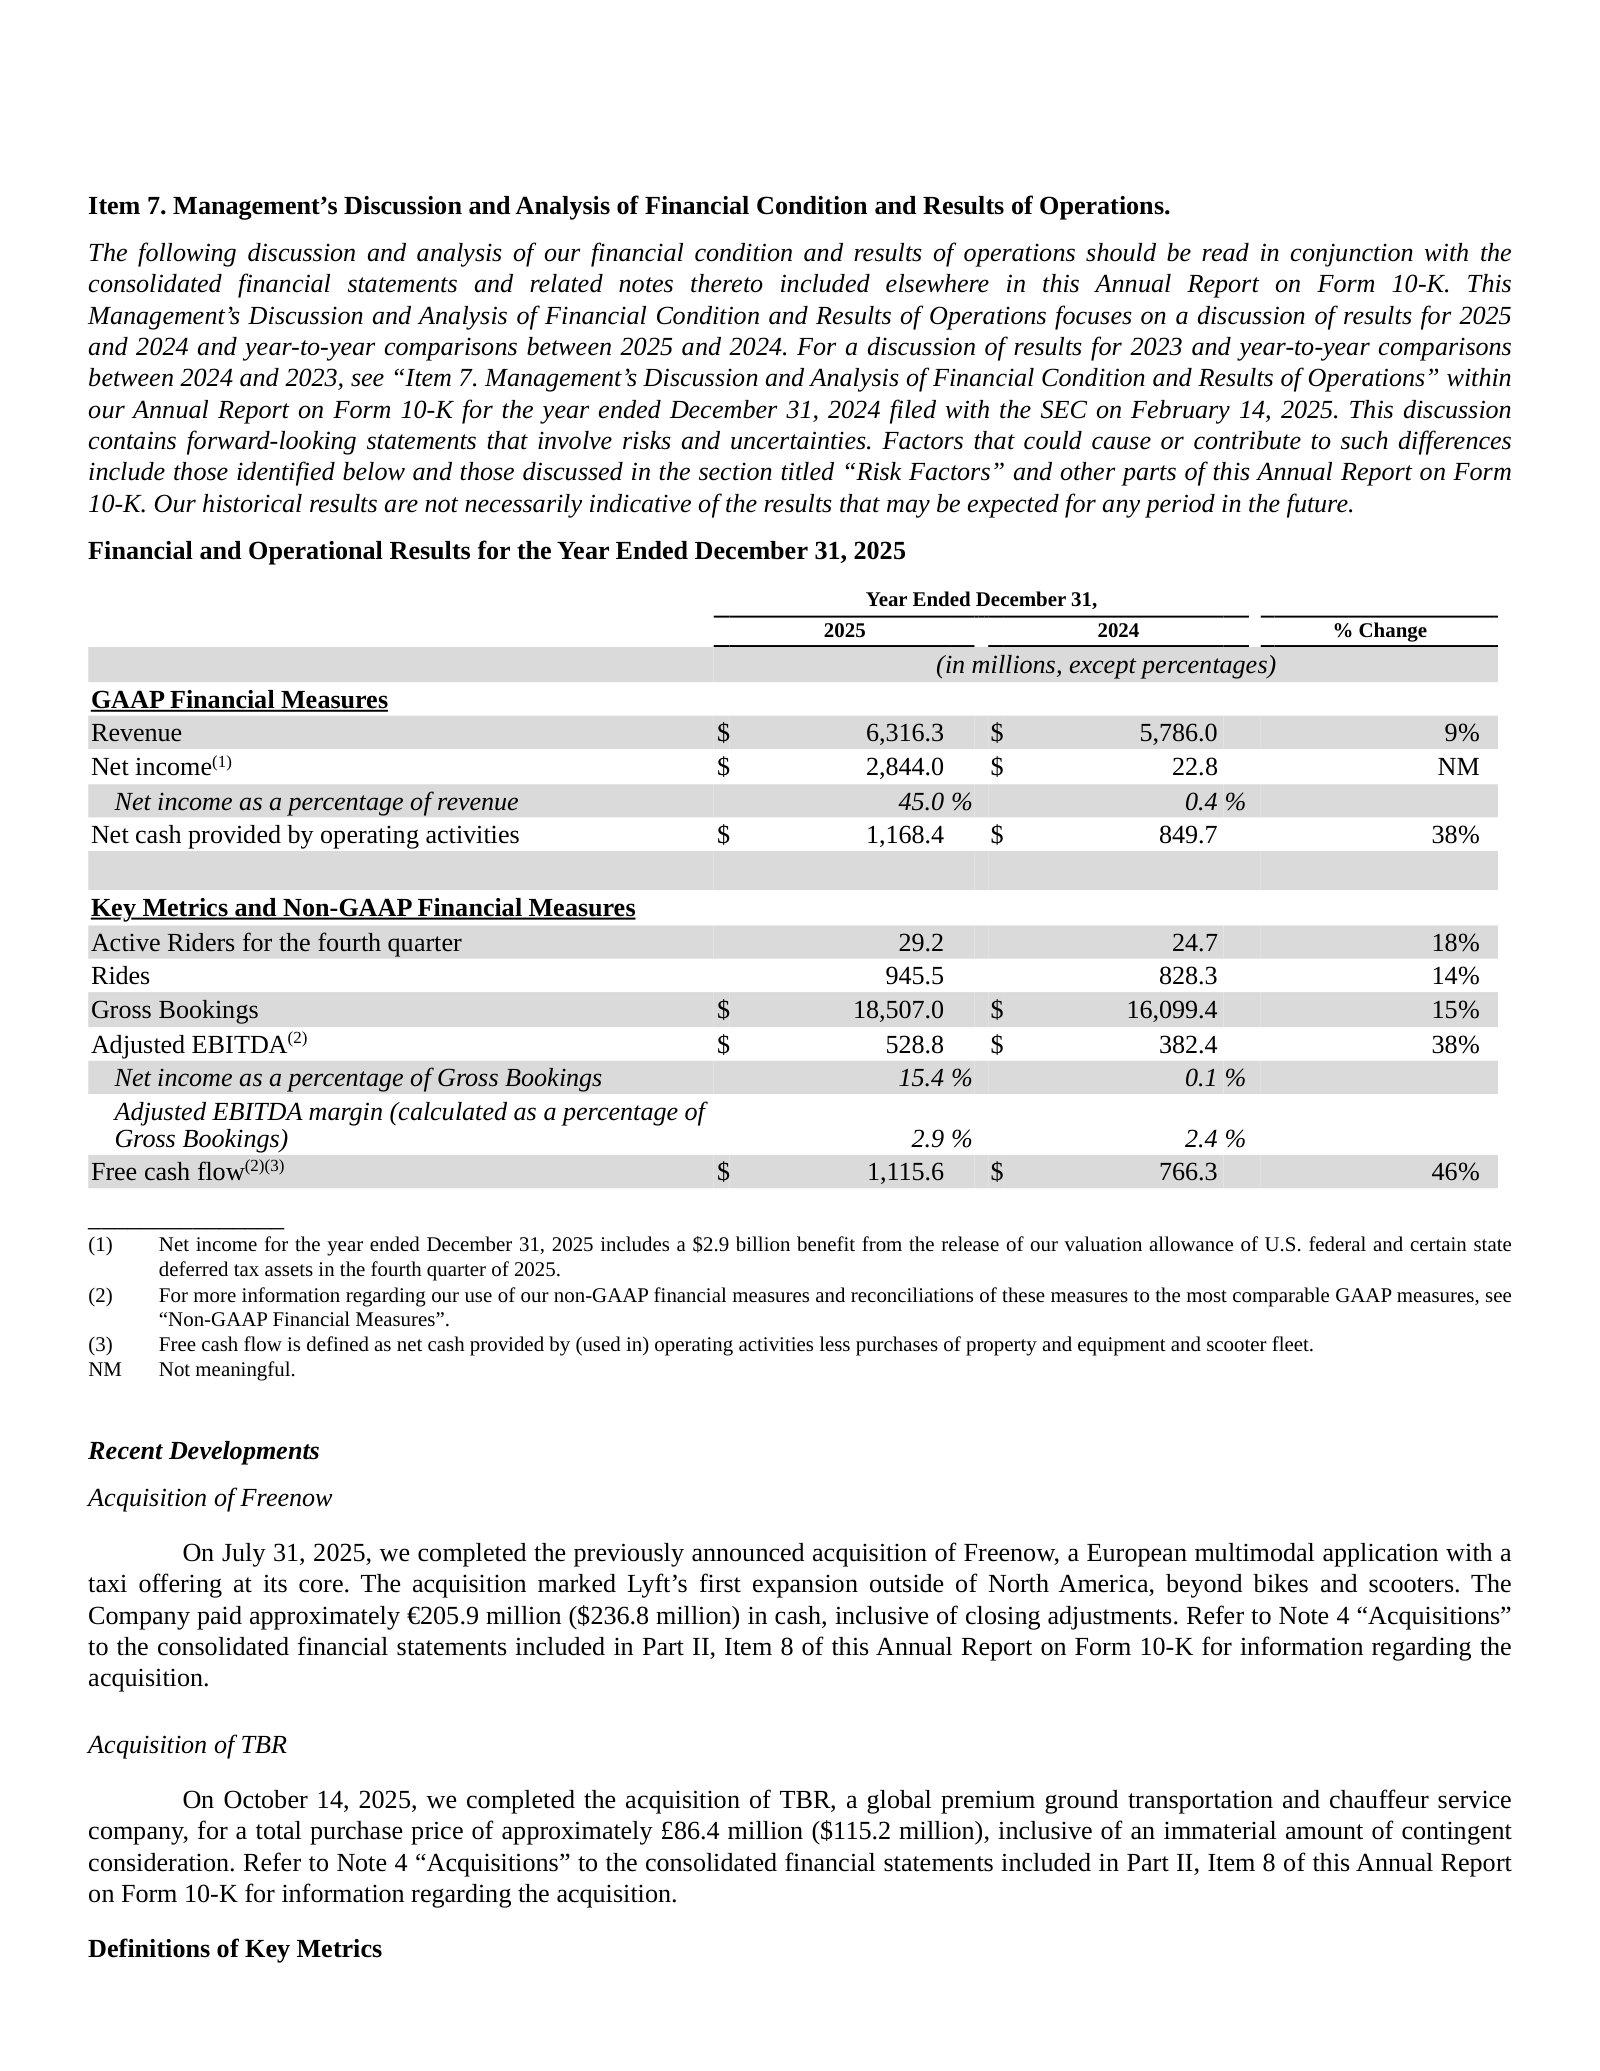
The Freenow and TBR deals — Lyft's first operations outside North America.
On July 31, 2025, we completed the previously announced acquisition of Freenow, a European multimodal application with a taxi offering at its core. The acquisition marked Lyft’s first expansion outside of North America, beyond bikes and scooters. The Company paid approximately €205.9 million ($236.8 million) in cash, inclusive of closing adjustments. […] On October 14, 2025, we completed the acquisition of TBR, a global premium ground transportation and chauffeur service company, for a total purchase price of approximately £86.4 million ($115.2 million), inclusive of an immaterial amount of contingent consideration.
p. 95 · Read in context →
Item 7. MD&A — Results of Operations — p. 102 · Read the full section →
Where the profit story meets reality: an operating loss beneath the headline net income, driven by climbing insurance costs.
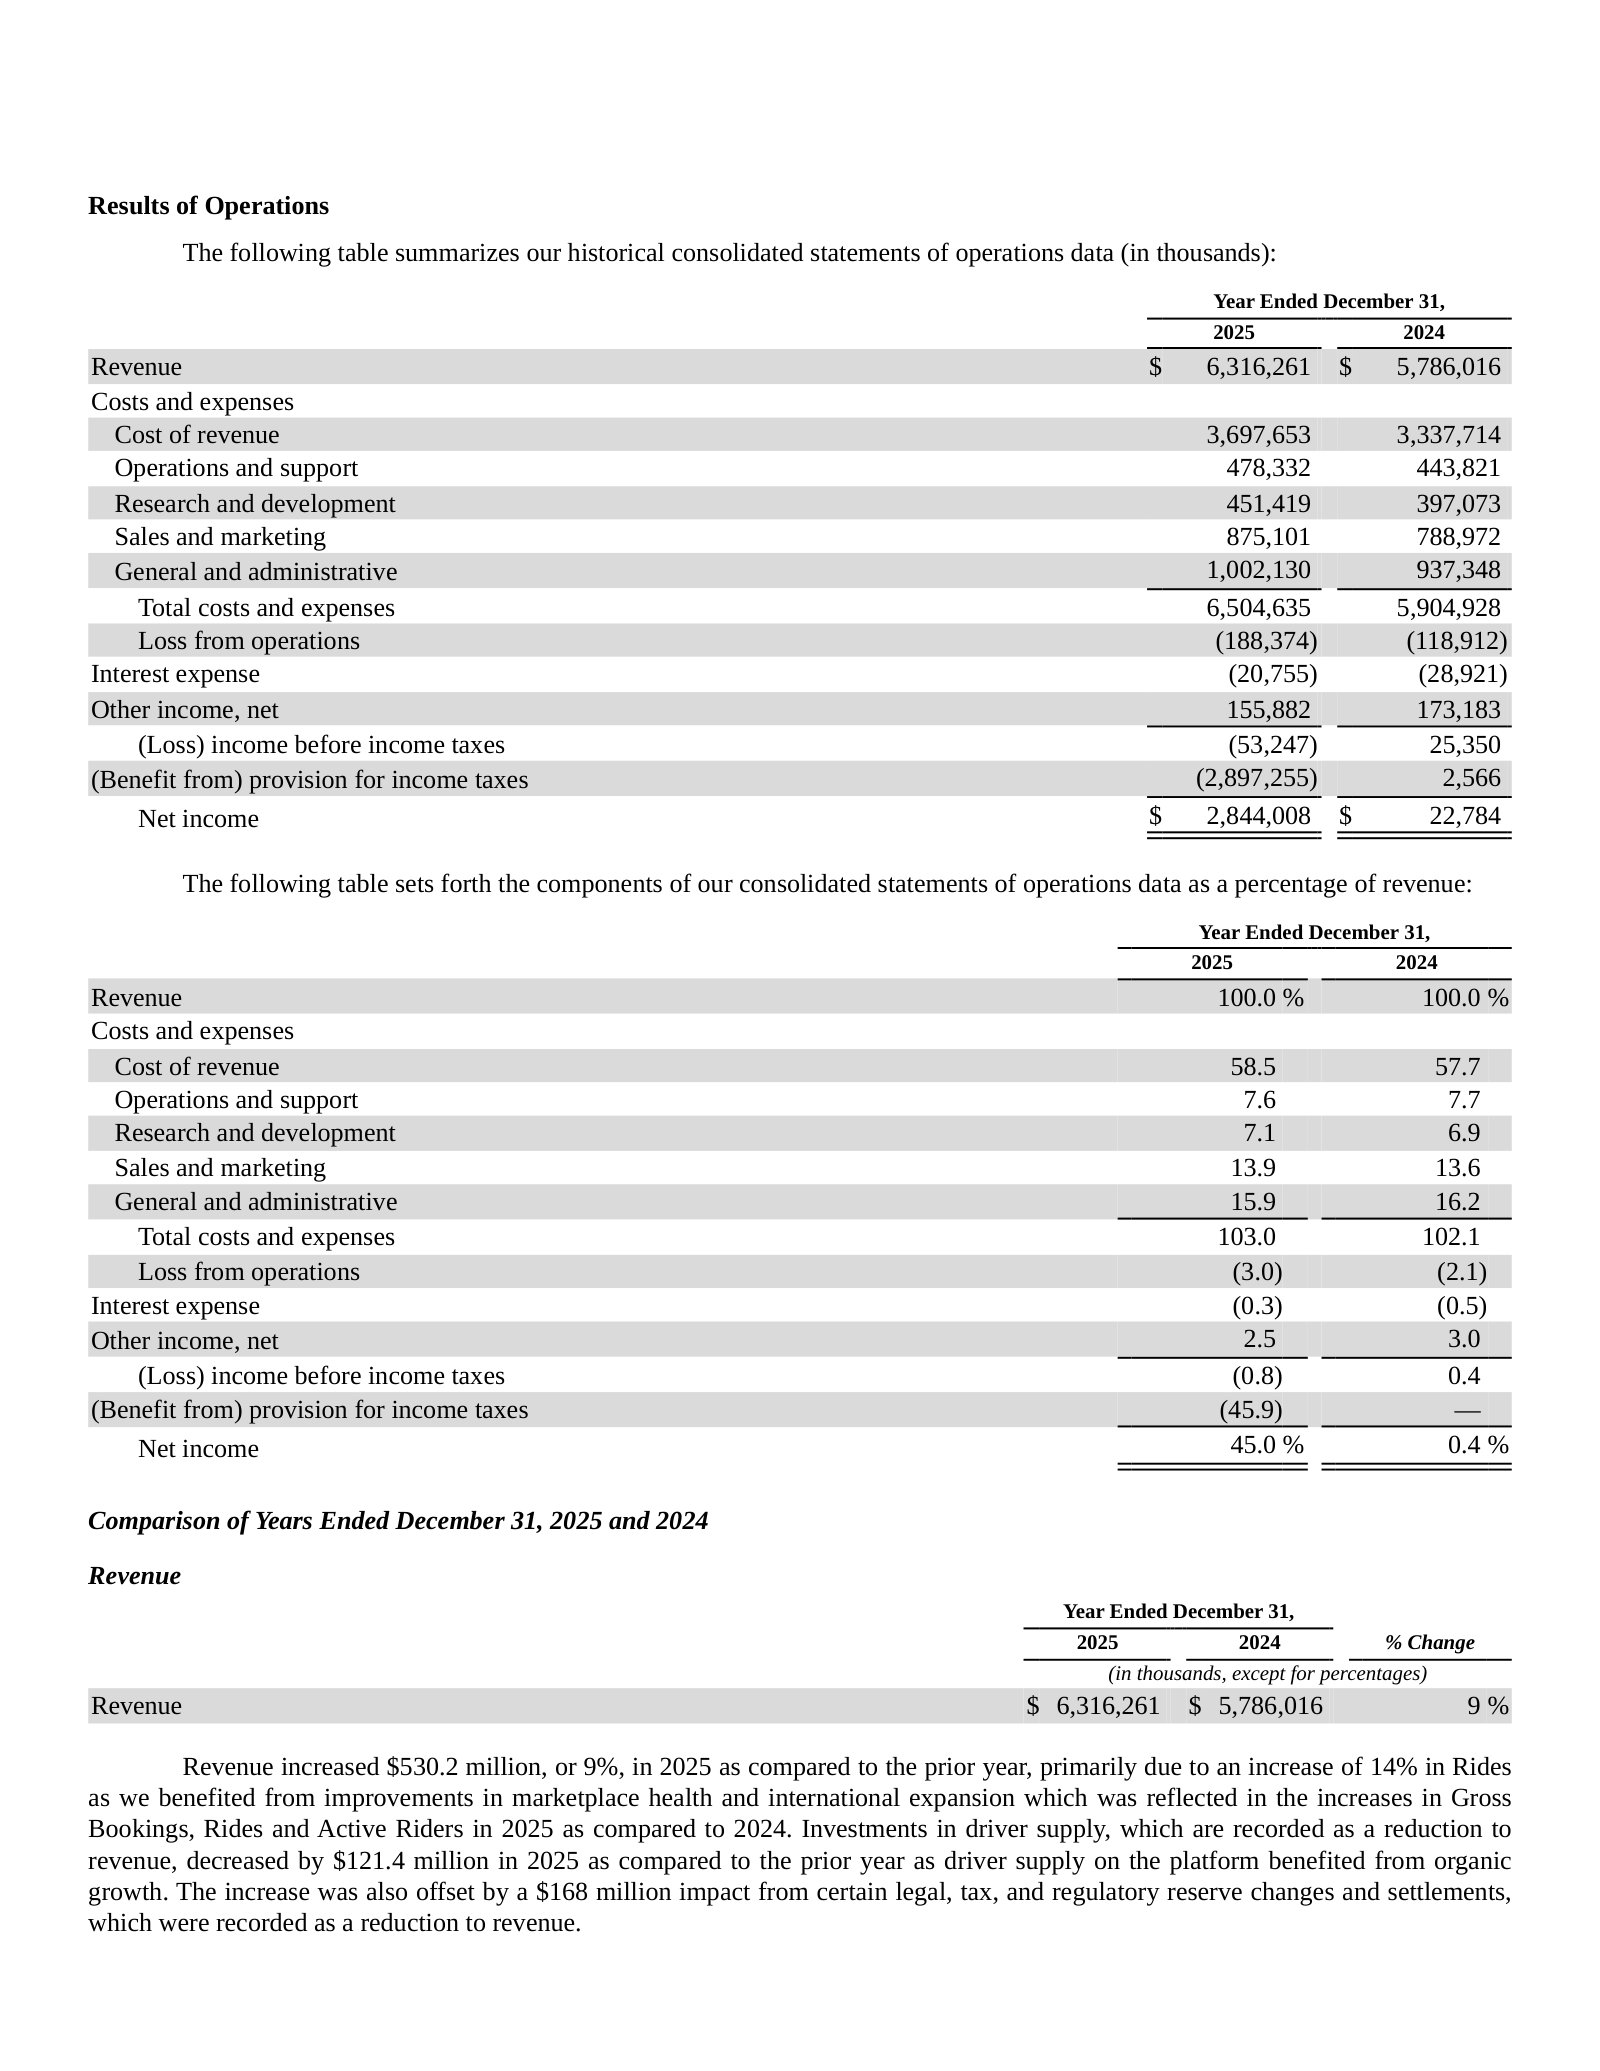
Insurance is the cost line to watch; California's SB 371 is management's hoped-for relief.
Cost of revenue increased $359.9 million, or 11%, in 2025 as compared to the prior year. The increase was primarily due to a $337.8 million increase in insurance costs driven by increased ride volume paired with higher costs per mile. […] We expect to see cost of revenue increase in the near term on a year-over-year basis due to higher insurance costs driven by recent economic factors and the renewals of our third party insurance agreements, but we expect total insurance costs will increase at a lower rate than they have historically as a result of a recently passed rideshare insurance reform bill, SB 371, which is expected to reduce our insurance rate in California.
p. 104 · Read in context →
Note 2. Summary of Significant Accounting Policies — Revenue Recognition — p. 137 · Read the full section →
The accounting choice that defines the model: Lyft books net (agent) revenue in most markets, gross (principal) where it controls the ride.
Agent vs principal — why reported revenue is a fraction of the fares riders actually pay.
The Company generates revenue from service fees and commissions (collectively, “fees”) paid by drivers for use of the Lyft Platform and related activities to connect drivers with riders to facilitate and successfully complete rides via the Lyft apps. […] In most cases, the Company is acting as an agent in facilitating the ability of a driver to provide a transportation service to a rider. In these cases, the Company reports revenue on a net basis, reflecting the fee owed to the Company from a driver as revenue, and not the gross amount collected from the rider. In certain markets, the Company acts as a principal for transportation services as the Company controls the services provided. Revenue generated in these markets is reported on a gross basis reflecting the gross amount collected from the rider, with payments to the drivers recorded within cost of revenue.
p. 137 · Read in context →
Lyft, Inc. — FY2024 Annual Report (Form 10-K) — FY2024
Included only for its business description, which still bounds Lyft to the US and Canada — the baseline the FY2025 global pivot departs from. · Open the full document →
Item 1. Business — p. 6 · Read the full section →
The pre-acquisition framing — Lyft as a US-and-Canada network — makes the FY2025 global pivot visible.
One year earlier, Lyft described itself strictly as a North American transportation network.
Today, Lyft is one of the largest multimodal transportation networks in the United States and Canada. […] Our ridesharing marketplace connects drivers with riders via the Lyft mobile application (the “Lyft App”) in cities across the United States and in certain cities in Canada.
p. 6 · Read in context →
More annual reports
Lyft, Inc. — FY2023 Annual Report (Form 10-K) — FY2023 · 223 pages · The last pre-profit year, covering the September 2024 restructuring and management transition. · Open →
Lyft, Inc. — FY2022 Annual Report (Form 10-K) — FY2022 · 167 pages · Peak-loss era; useful for the earlier cost structure and the April 2023 restructuring plan. · Open →
Lyft, Inc. — FY2021 Annual Report (Form 10-K) — FY2021 · 156 pages · The post-pandemic recovery year, with the original mission framing and Shared Rides still in wide use. · Open →
Source: S&P Capital IQ consensus via Xpressfeed · Generated 2026-07-24.
S&P Capital IQ consensus shows a profitability-led upgrade: normalized-EPS estimates for FY2027-28 have been marked up roughly 14% over the past six months while revenue forecasts held roughly flat. Growth is set to cool from low-double-digits toward mid-single-digits by FY2029, even as EBITDA continues to outpace the top line. The Street stays cautious - about two-thirds rate Lyft Hold - and outer-year EPS coverage thins to a handful of analysts.
Normalized-EPS estimates marked up ~14% in six months while revenue holds flat
The mark-up landed three-to-six months ago; over the last 30 days both lines have essentially stopped moving.
Currency: USD · Scale: money in millions, absolute · Point-in-time consensus; Δ90d is Now versus 90d.
| Metric | FY | 180d | 90d | 30d | Now | Δ90d |
|---|---|---|---|---|---|---|
| EPS (normalized) | FY2027 | $1.83 | $1.86 | $2.09 | $2.09 | +12.5% |
| EPS (normalized) | FY2028 | $1.86 | $2.11 | $2.13 | $2.12 | +0.2% |
| Revenue | FY2027 | $8.25bn | $8.15bn | $8.20bn | $8.20bn | +0.6% |
| Revenue | FY2028 | $8.96bn | $8.77bn | $8.84bn | $8.84bn | +0.8% |
Revenue growth steps down from ~12% to ~6% by FY2029 as EBITDA keeps climbing
Currency: USD · Scale: money in millions, absolute · YoY uses the prior fiscal year from the feed; analyst count and range use the first displayed period.
| Metric | FY2026E | FY2027E | FY2028E | FY2029E | YoY | Analysts | Low / high |
|---|---|---|---|---|---|---|---|
| Revenue | $7.30bn | $8.20bn | $8.84bn | $9.35bn | +15.6% | 40 | $6.92bn / $7.65bn |
| EBITDA | $679.68m | $862.63m | $987.03m | $1.01bn | +28.5% | 39 | $479.00m / $733.80m |
| EPS (normalized) | $1.55 | $2.09 | $2.12 | $1.68 | +23.7% | 13 | $1.26 / $2.02 |
Revenue hugs consensus while normalized-EPS surprises swing from +16% to -47%
Current sequences by metric: Revenue: 1 consecutive beat; EPS (normalized): 1 consecutive miss.
Currency: USD · Scale: money in millions, absolute · Consensus is captured before each actual first became effective.
| Quarter | Metric | Consensus | Actual | Surprise | Outcome |
|---|---|---|---|---|---|
| Q1 FY2026 | Revenue | $1.63bn | $1.65bn | +1.1% | Beat |
| Q1 FY2026 | EPS (normalized) | $0.29 | $0.28 | -2.3% | Miss |
| Q4 FY2025 | Revenue | $1.75bn | $1.59bn | -9.2% | Miss |
| Q4 FY2025 | EPS (normalized) | $0.32 | $0.37 | +16.0% | Beat |
| Q3 FY2025 | Revenue | $1.70bn | $1.69bn | -0.8% | Miss |
| Q3 FY2025 | EPS (normalized) | $0.31 | $0.30 | -2.2% | Miss |
| Q2 FY2025 | Revenue | $1.61bn | $1.59bn | -1.4% | Miss |
| Q2 FY2025 | EPS (normalized) | $0.28 | $0.30 | +5.6% | Beat |
| Q1 FY2025 | Revenue | $1.46bn | $1.45bn | -0.9% | Miss |
| Q1 FY2025 | EPS (normalized) | $0.20 | $0.11 | -46.7% | Miss |
| Q4 FY2024 | Revenue | $1.54bn | $1.55bn | +0.6% | Beat |
| Q4 FY2024 | EPS (normalized) | $0.23 | $0.27 | +17.5% | Beat |
| Q3 FY2024 | Revenue | $1.44bn | $1.52bn | +5.7% | Beat |
| Q3 FY2024 | EPS (normalized) | $0.20 | $0.29 | +42.7% | Beat |
| Q2 FY2024 | Revenue | $1.39bn | $1.44bn | +3.6% | Beat |
| Q2 FY2024 | EPS (normalized) | $0.19 | $0.24 | +25.0% | Beat |
Where the street disagrees
Currency: USD · Scale: money in millions, absolute · Spread/mean is absolute high-low divided by absolute mean.
| Metric | Period | Mean | Low–high | Spread/mean | Analysts |
|---|---|---|---|---|---|
| Net income (GAAP) | FY2027E | $369.53m | $180.80m–$691.00m | 138.1% | 32 |
| EPS (normalized) | FY2027E | $2.09 | $1.54–$3.40 | 89.0% | 13 |
| EBITDA | FY2028E | $987.03m | $639.00m–$1.12bn | 48.4% | 24 |
Two-thirds rate Lyft Hold; targets run $14-$30 around an $18 median
Currency: USD · Scale: money in millions, absolute · Analyst counts shown explicitly.
| Street view | Reading | Analysts |
|---|---|---|
| Recommendation mix | Buy 10, Outperform 4, Hold 28, Underperform 1, Sell 0 | 43 |
| Consensus score | 2.47 | 43 |
| Target price | mean $19.00; median $18.00; high $30.00; low $14.00 | 36 |
Outer-year normalized-EPS rests on just 3-6 analysts
Treat FY2028-29 normalized-EPS consensus as indicative; revenue and EBITDA coverage runs deeper (11-24 analysts) but also thins after FY2027.
Visible Alpha broker models via S&P Xpressfeed · 34 brokers · 372 line items · freshest revision 2026-07-21.
Broker models agree almost completely on Lyft's demand engine and disagree almost entirely on what it earns. Rides, bookings, and revenue cluster within a few percent across ~30 brokers, but operating income and free cash flow span multiples. The modeled arc is a growth downshift paired with a profit inflection: gross bookings decelerate toward high-single-digit growth by FY-2028 while Adjusted EBITDA roughly doubles and GAAP operating income turns decisively positive.
Key drivers
| Line | FY-2025A | FY-2026E | FY-2027E | FY-2028E | YoY | Brokers |
|---|---|---|---|---|---|---|
| Demand | — | — | — | — | — | — |
| Gross bookings | $18.51bn | $21.70bn | $24.48bn | $26.59bn | +17.2% | 30 |
| Rides(M#) | 958.36m Number | 1.04bn Number | 1.15bn Number | 1.24bn Number | +8.8% | 31 |
| Active Riders(M#) | 28.03m Number | 31.10m Number | 33.80m Number | 36.12m Number | +10.9% | 28 |
| Pricing | — | — | — | — | — | — |
| Bookings per ride($) | $19.32 | $20.87 | $21.20 | $21.45 | +8.0% | 30 |
| Revenue as % of bookings (Take rate)(%) | 34.8% | 33.9% | 34.0% | 34.0% | -0.9pt | 24 |
Key drivers
| Line | FY-2025A | FY-2026E | FY-2027E | FY-2028E | YoY | Brokers |
|---|---|---|---|---|---|---|
| Profit | — | — | — | — | — | — |
| Adjusted EBITDA | $519.90m | $691.39m | $879.21m | $1.00bn | +33.0% | 33 |
| Contribution | $2.86bn | $3.50bn | $3.93bn | $4.29bn | +22.6% | 31 |
| Income/(loss) from operations | $33.29m | $179.42m | $373.49m | $449.01m | +438.9% | 30 |
| Margins | — | — | — | — | — | — |
| Contribution margin(%) | 43.3% | 46.6% | 46.5% | 48.4% | +3.3pt | 20 |
Where broker models disagree
| Line | Period | Median | Q1–Q3 | Min–max | Brokers |
|---|---|---|---|---|---|
| Free Cash flow (FCF) | FY-2027E | $1.27bn | $1.05bn–$1.37bn | $688.44m–$2.03bn | 27 |
| Income/(loss) from operations | FY-2027E | $355.47m | $300.02m–$386.40m | $199.31m–$932.54m | 29 |
| Income/(loss) from operations | FY-2028E | $439.44m | $392.26m–$504.88m | $303.99m–$611.06m | 19 |
Lyft Media is thinly-covered optionality — ad revenue modeled ~$68m to ~$248m, FY-2025 to FY-2027
Only three brokers break out advertising, and they model it more than tripling from ~$68m (FY-2025) to ~$248m (FY-2027) — still under ~4% of revenue. The market's high-margin optionality is real in the models but too thinly covered to anchor a thesis.
Headline P&L consensus, momentum and beat/miss live in the CapIQ tab.
Source: S&P Capital IQ transcripts via Xpressfeed · latest indexed call 2026-05-07 · generated 2026-07-24.
Latest call digest
Lyft, Inc., Q1 2026 Earnings Call, May 07, 2026 · 2026-05-07T21:00:00
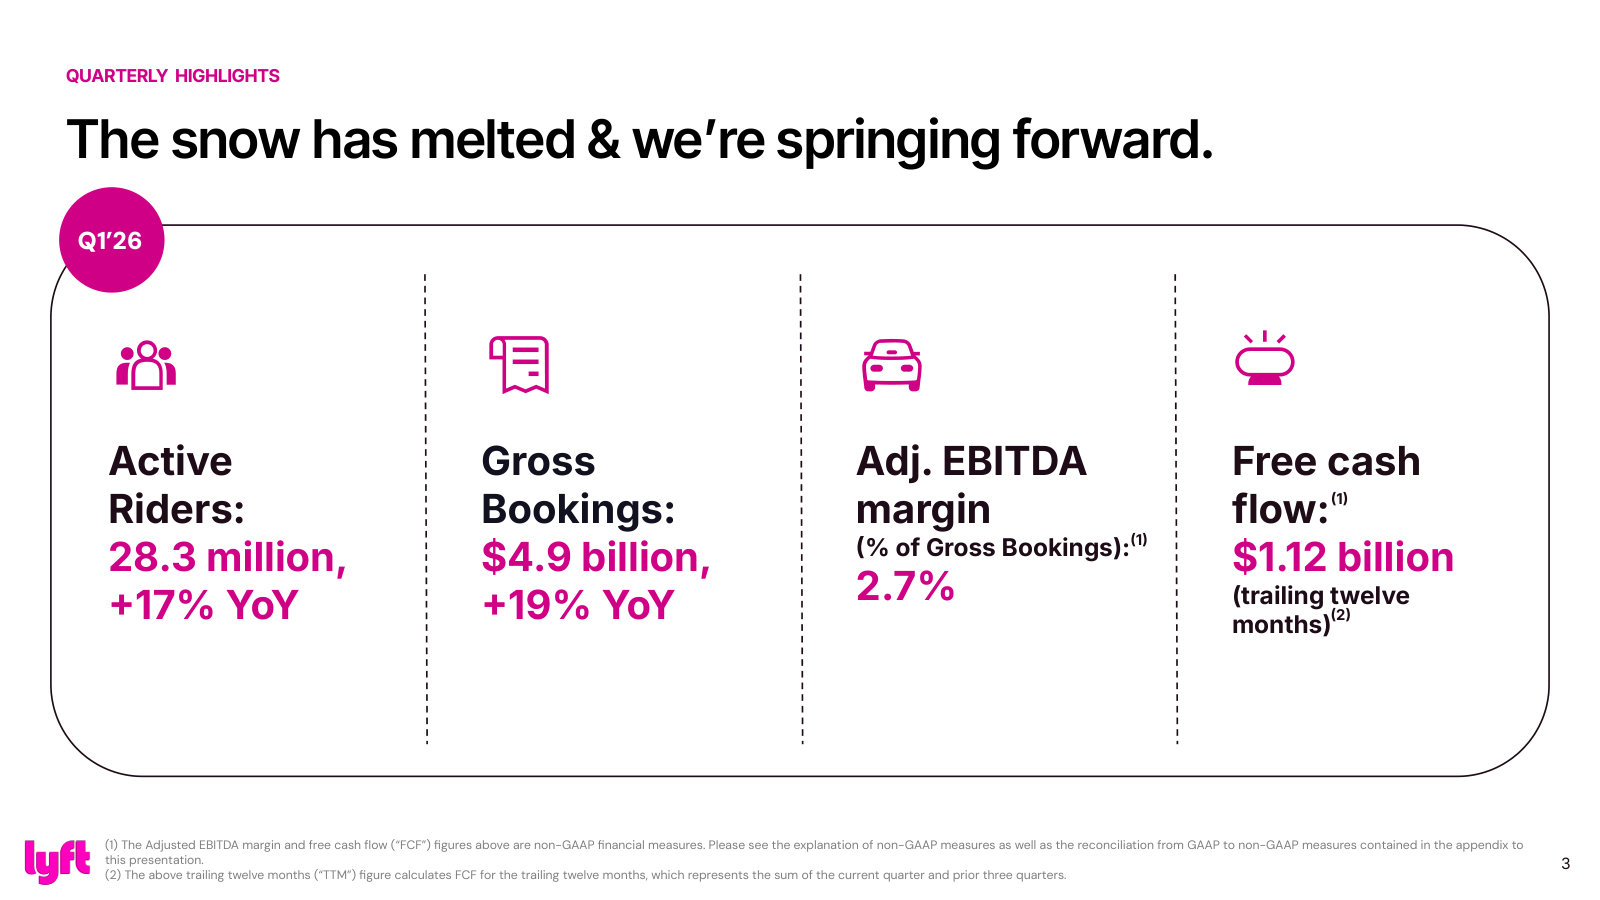
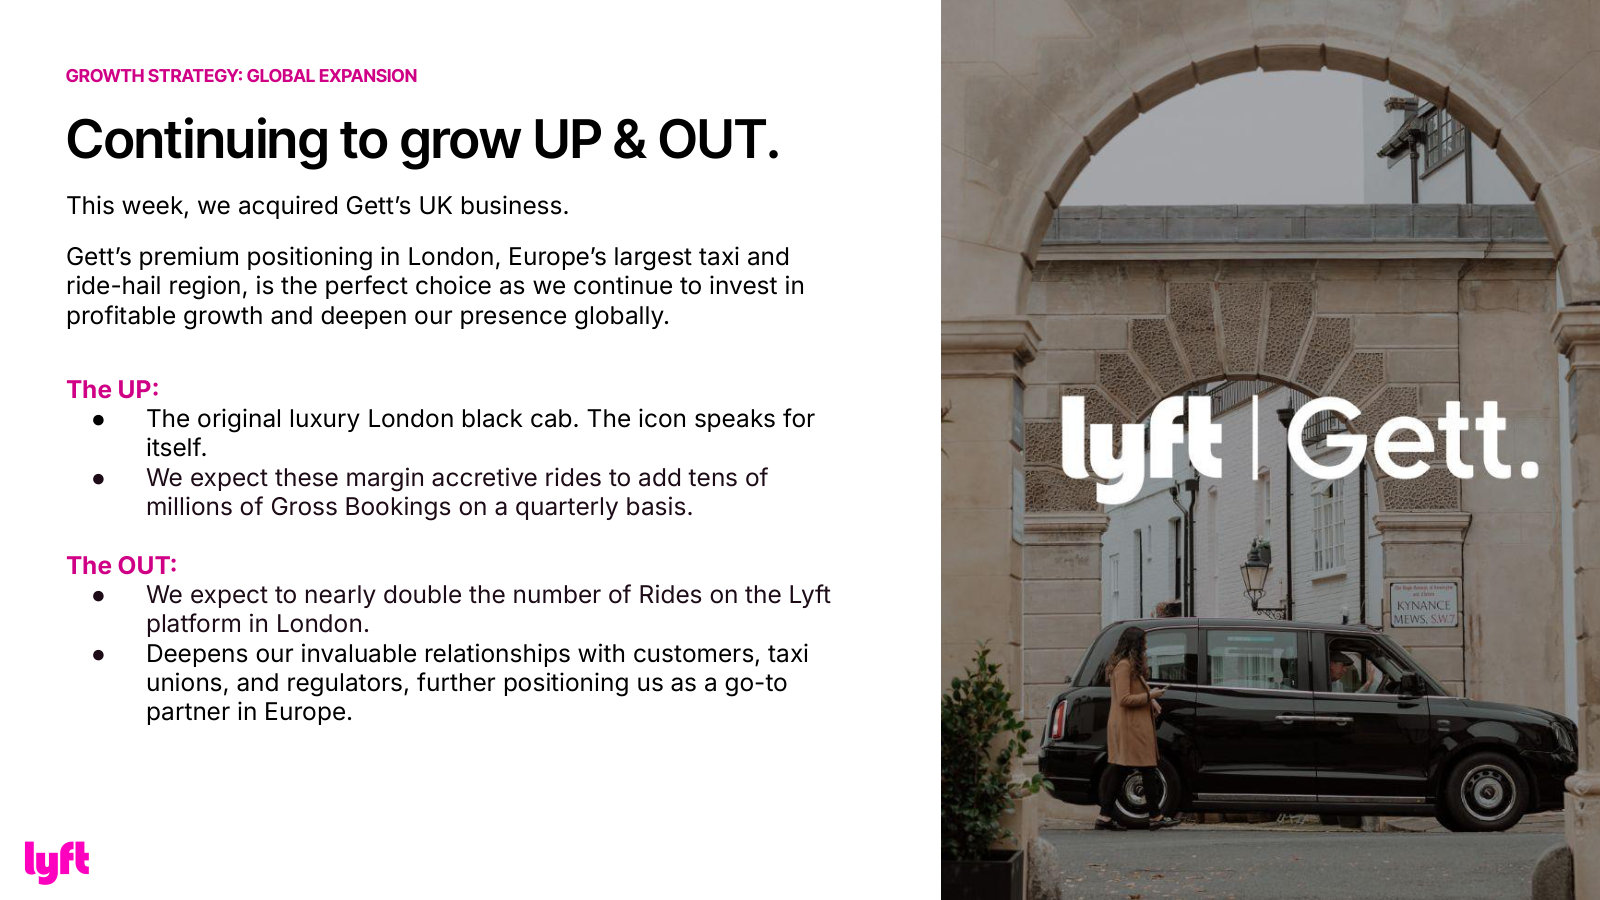
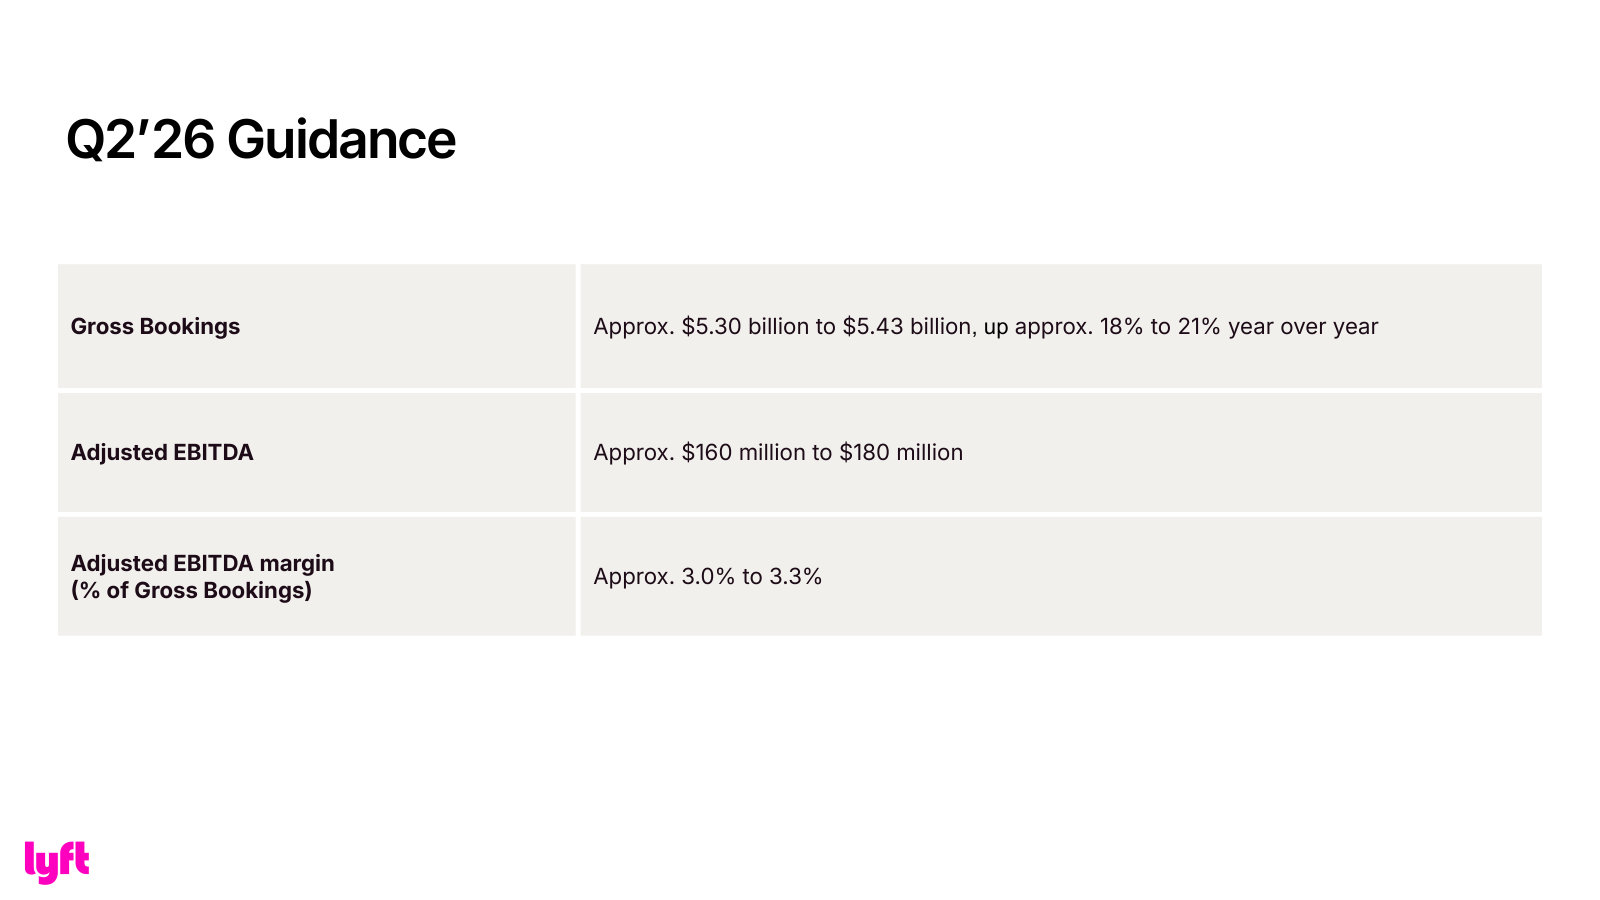
Q1 2026 call (May 7, 2026) was, as with every call since Q1 2025, a Q&A-only session: full prepared remarks were posted to the IR website beforehand, and management opened with only brief highlights. CFO Erin Brewer's opener stated the quarter's hard numbers — gross bookings up 19% and adjusted EBITDA up 25% year-over-year, a record $1.12 billion trailing-twelve-month free cash flow, and the largest quarterly buyback ever at $300 million. CEO David Risher called it "another strong quarter," flagged the just-closed Gett U.K. acquisition, an over-120-country footprint, and progress on the Waymo Nashville AV depot.
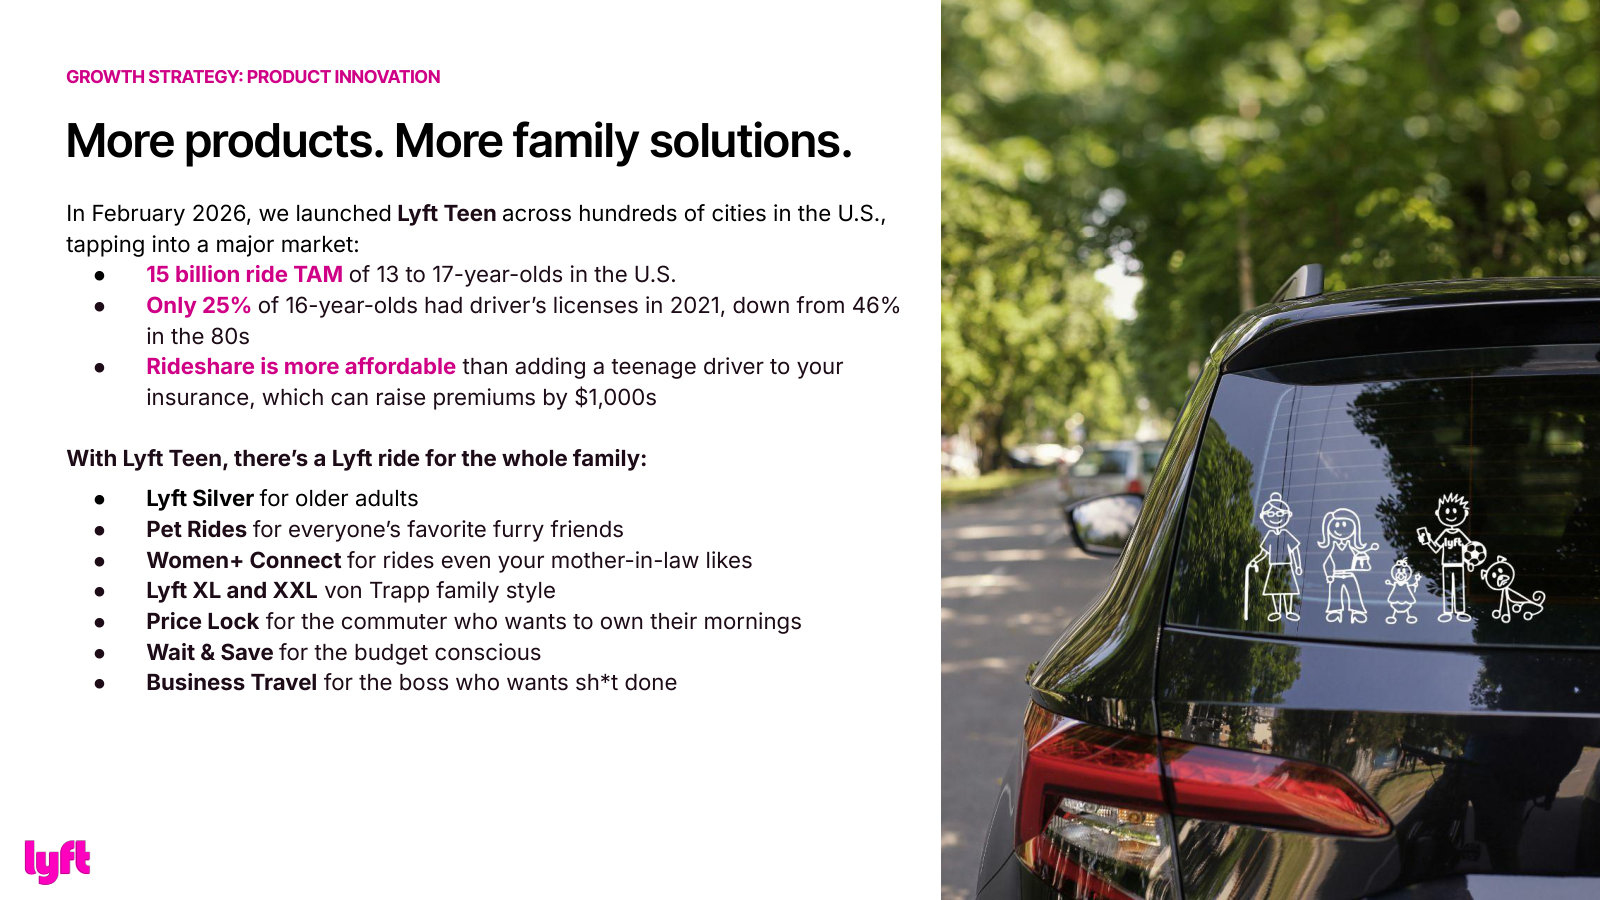
The Q&A was more pointed than the upbeat opener. The tension analysts kept returning to was the widening gap between ~19-20% gross-bookings growth and slowing ride volumes: North America ride growth fell to mid-single digits (with Canada up roughly 50%), which Brewer partly attributed to weather (about 3 million lost rides) and seasonality. Management's answer on volume leaned on newer levers — low-scale markets, Lyft Silver, Lyft Teen, partnership-tagged rides at a record 27% of requests, and higher-value modes up over 35% — rather than the core U.S. base. Guidance actually stated on the call: Q2 gross bookings accelerating to approximately 20% and adjusted EBITDA expanding more than 30% year-over-year, plus a full-year objective of north of 1 billion rides. Autonomous vehicles remained the recurring pressure point, with questions on San Francisco share versus Waymo, the three named AV cities (Nashville, London, Hamburg), and unit economics.
Participant coverage from the latest call.
| Group | Participants | Count |
|---|---|---|
| Management | Erin Rheaume; John Risher — CEO & Director, Lyft, Inc.; Erin Brewer — Chief Financial Officer, Lyft, Inc. | 3 |
| Analysts | Eric Sheridan — MD & US Internet Analyst, Goldman Sachs Group, Inc., Research Division; Neeraj Kookada — Analyst, JPMorgan Chase & Co, Research Division; Nikhil Devnani — Research Analyst, Bernstein Institutional Services LLC, Research Division; Benjamin Black — Research Analyst, Deutsche Bank AG, Research Division; John Blackledge — MD & Senior Research Analyst, TD Cowen, Research Division; Michael Morton — MD & Senior Research Analyst, MoffettNathanson LLC; Kenneth Gawrelski — Senior Internet Analyst, Wells Fargo Securities, LLC, Research Division; Ross Sandler — MD of Americas Equity Research & Senior Internet Analyst, Barclays Bank PLC, Research Division; Charles Larkin — Research Analyst, Oppenheimer & Co. Inc., Research Division; Miles Jakubiak — Research Analyst, KeyBanc Capital Markets Inc., Research Division; Shweta Khajuria — MD & Senior Research Analyst, Wolfe Research, LLC; Rohit Kulkarni — MD & Senior Research Analyst, ROTH Capital Partners, LLC, Research Division | 12 |
Curated latest-call exchanges; one row per analyst topic.
| Analyst | Firm | Topic | What changed in Q&A |
|---|---|---|---|
| Eric Sheridan | Goldman Sachs | Partnerships as a growth engine | Asked what partnerships teach about frequency versus new-rider acquisition; Risher cited a record 27% of ride requests as partnership-tagged and contrasted DoorDash (volume and frequency) with United (higher-bookings airport rides). |
| Nikhil Devnani | Bernstein | North America rides deceleration | Pressed on mid-single-digit NA volume versus roughly 50% Canada growth and several quarters of decelerating U.S. rides; Risher conceded the largest, oldest U.S. markets are growing slower and pointed to low-scale markets, Silver, Teen and partnerships to reaccelerate. The hardest exchange of the call. |
| Benjamin Black | Deutsche Bank | Incentives per ride up 17% and AI cost | Questioned why per-ride incentives rose 17% and how AI/token spend is balanced against margins; Brewer framed the higher rider incentives as deliberate, ROI-driven investment funded by broader P&L leverage. |
| John Blackledge | TD Cowen | Gross bookings versus rides divergence | Asked whether the gap between gross-bookings and rides growth persists into the second half; Brewer expects it to narrow in Q2 on seasonal bikes, citing higher-value modes and FREENOW as the drivers of the divergence. |
| Michael Morton | MoffettNathanson | U.S. standalone pricing and ads | Sought a simple U.S. like-for-like price; Brewer declined a single figure, calling pricing sequentially stable Q4-to-Q1 and shaped by mix, while Risher reiterated ad-business optimism without a new run-rate figure. |
| Rohit Kulkarni | ROTH Capital Partners | AV rollout across Nashville, London, Hamburg | Asked how Lyft operates across the three AV cities; Risher detailed the Waymo Nashville depot and summer operations handoff, Baidu London early street-mapping, and a city-level Hamburg partnership. |
Theme tracker
Themes are curator-classified across supplied calls.
| Theme | Status | Quarters mentioned | Read-through |
|---|---|---|---|
| Autonomous vehicles and the hybrid network | persisted | Q1 2024, Q2 2024, Q3 2024, Q4 2024, Q1 2025, Q2 2025, Q3 2025, Q4 2025, Q1 2026 | AV moved from an abstract 'opportunity' in 2024 to concrete partnerships and a hybrid-network thesis: May Mobility, Mobileye/Marubeni, Baidu, and the Waymo Nashville integrated-supply deal. The pitch (TAM expansion, Flexdrive fleet operations, a stated ~20% lower cost per mile by 2030) is consistent, but management repeatedly declines to give breakeven utilization or per-deal economics. |
| Partnership-tagged rides | persisted | Q2 2023, Q4 2023, Q1 2024, Q3 2024, Q4 2024, Q1 2025, Q2 2025, Q3 2025, Q1 2026 | Partnership-linked rides climbed from a roughly 20% Investor Day baseline to 25% (Q2 2025) to a record 27% (Q1 2026), spanning DoorDash, United, Chase, Bilt, Alaska and Hilton. Consistently framed as higher-bookings, higher-margin rider acquisition. |
| International expansion via FREENOW and Europe | emerged | Q1 2025, Q2 2025, Q3 2025, Q4 2025, Q1 2026 | FREENOW (announced Q1 2025, closed Q2 2025) doubled the stated addressable market and reframed Lyft as a European operator, later extended by TBR chauffeuring and the Gett U.K. deal. Management stresses growth with limited incremental investment and a roughly EUR 1 billion run rate. |
| California insurance reform (SB 371) | emerged | Q3 2025, Q4 2025, Q1 2026 | SB 371 insurance reform, effective January 1 2026, is pitched as a rider/driver/Lyft win-win-win; the demand benefit is expected to build into the second half of 2026, with early Q1 2026 California growth said to outpace other top regions. |
| High-value modes and premiumization | persisted | Q3 2023, Q1 2024, Q4 2024, Q1 2025, Q2 2025, Q3 2025, Q4 2025, Q1 2026 | From Extra Comfort (2023) and Lyft Black (up 41% in 2024) to TBR global chauffeuring, premium modes are the recurring margin-mix story; high-value modes grew about 50% in 2025 and over 35% year-over-year in Q1 2026. |
| Lyft Media / advertising | persisted | Q2 2023, Q4 2023, Q1 2024, Q2 2024, Q3 2024, Q4 2024, Q1 2025, Q4 2025 | Advertising scaled from a concept to a roughly $50 million exit run rate in 2024 and a roughly $100 million exit run rate confirmed in Q4 2025; consistently described as high-margin, with first-party data as the edge. |
| Primetime reduction and Price Lock reliability | dropped | Q3 2023, Q4 2023, Q1 2024, Q2 2024, Q3 2024, Q4 2024, Q1 2025, Q2 2025 | The dominant 2023-2024 narrative — cutting surge pricing ('Primetime') and the Price Lock subscription — faded from prepared emphasis and Q&A by the second half of 2025 as loyalty programs and premiumization took over the growth story. The products still exist; the messaging receded. |
| Loyalty programs (Business Rewards, Lyft Cash Rewards) | emerged | Q3 2025, Q4 2025, Q1 2026 | A refreshed free business-rewards program (launched September 2025, 6% back) and a consumer Lyft Cash Rewards pilot became a recurring 'stay tuned' theme in late-2025 and Q1 2026, positioned explicitly against a competitor's paid membership. |
Guidance ledger
Quotes, calls, and speakers are source-verified; outcomes are curator-classified.
| Verbatim guidance | Call | Speaker | Curator outcome | Outcome note |
|---|---|---|---|---|
| “At the midpoint of our range, we expect gross bookings to accelerate to approximately 20% and adjusted EBITDA to expand by more than 30% year-over-year.” | Lyft, Inc., Q1 2026 Earnings Call, May 07, 2026 · 2026-05-07T21:00:00 | Erin Brewer | pending | Q2 2026 results fall after the supplied call history, so the outcome cannot yet be judged. |
| “our overall objective to deliver north of 1 billion rides for the full year.” | Lyft, Inc., Q1 2026 Earnings Call, May 07, 2026 · 2026-05-07T21:00:00 | Erin Brewer | pending | Full-year 2026 objective; no later call in the supplied history reports the result. |
| “That's $25 billion in gross bookings, 4% adjusted EBITDA margin and free cash flow of over $1 billion.” | Lyft, Inc., Q4 2025 Earnings Call, Feb 10, 2026 · 2026-02-10T22:00:00 | John Risher | pending | 2027 Investor Day targets, reaffirmed here; the horizon is beyond the supplied call history. |
| “Our guide for the fourth quarter is for rides to be up mid- to high teens, gross bookings up 17% to 20%.” | Lyft, Inc., Q3 2025 Earnings Call, Nov 05, 2025 · 2025-11-05T21:30:00 | Erin Brewer | kept | On the Q4 2025 call management reported gross bookings up 19% year-over-year, within the guided 17%-20% range. |
| “our expectation for the Media business in 2025, again, thinking about a Q4 exit rate, would be an annualized bookings run rate of approximately $100 million.” | Lyft, Inc., Q4 2024 Earnings Call, Feb 11, 2025 · 2025-02-11T22:00:00 | Erin Brewer | kept | The Q4 2025 call confirmed the ads business reached the roughly $100 million exit run rate. |
| “For the fourth quarter of 2024, we expect gross bookings growth of approximately 15% to 17% year-over-year or approximately $4.28 billion to $4.35 billion.” | Lyft, Inc., Q3 2024 Earnings Call, Nov 06, 2024 · 2024-11-06T22:00:00 | Erin Brewer | kept | Q4 2024 gross bookings came in at $4.28 billion, up 15% year-over-year, at the low end of the guided range. |
| “we now expect that more than 90% of adjusted EBITDA will convert to free cash flow for the full year 2024.” | Lyft, Inc., Q2 2024 Earnings Call, Aug 07, 2024 · 2024-08-07T12:15:00 | Erin Brewer | kept | Full-year 2024 free cash flow was reported at $766 million, above the 90%-plus conversion target. |
Q&A pressure map
Question counts and firms are curator tallies; analyst coverage shown above.
| Topic | Questions | Firms | Pressure / response |
|---|---|---|---|
| Autonomous-vehicle economics, partnerships and rollout | 25 | Goldman Sachs, Bernstein, MoffettNathanson, Deutsche Bank, BofA Securities, Barclays, RBC Capital Markets, UBS | The single most-pressed topic across the twelve calls. Analysts repeatedly probed unit economics, accretion, the Waymo revenue-share/hybrid structure and breakeven utilization. Management leaned on TAM expansion and Flexdrive fleet operations but declined to give the breakeven availability and utilization figures an analyst directly requested in Q3 2025. |
| Pricing and the gross-bookings-per-ride versus rides divergence | 21 | JPMorgan, MoffettNathanson, Wells Fargo, Deutsche Bank, BofA Securities, Barclays | A persistent line of questioning on take rate, base pricing and why bookings-per-ride diverges from rides. Management consistently redirects to mix (bikes, high-value modes, FREENOW, ads) and a 'competitive and reliable' pricing strategy rather than a single like-for-like number. |
| Insurance costs and California / state reform | 14 | Wells Fargo, Bernstein, Deutsche Bank, JPMorgan, TD Cowen | Recurring pressure on renewal rates, self-insurance versus risk transfer, and the demand impact of SB 371. Management points to bending the insurance cost curve and a phased California demand benefit expected to build into the second half of 2026. |
| FREENOW / Europe integration and required investment | 10 | Wells Fargo, MoffettNathanson, Deutsche Bank, Bernstein, Barclays, RBC Capital Markets | Analysts pressed on how much capital Europe needs and whether the acquired businesses fit together strategically. Management repeatedly frames the spend as modest and the assets as growth- and AV-enabling. |
| U.S. rideshare demand and rides deceleration | 6 | Fox Advisors, Bernstein, Wolfe Research, TD Cowen, JPMorgan | Questions on consumer softness and slowing volumes. Through mid-2025 management said it saw 'no signs of weakening'; by Q1 2026 it acknowledged slower growth in the largest, most-mature U.S. markets and cited weather and seasonality. |
Language shifts
Only language evidence verified against the referenced component is shown.
| Observation | Verbatim evidence | Call ID | Component |
|---|---|---|---|
| Early AV framing was explicitly hedged: in Q1 2025 management repeatedly stressed uncertainty about pricing, frequency and long-term economics. | “probably the dominant thing to take away on that is a little too early to tell.” | 1939742145 | 18 |
| A year later the AV tone had turned emphatically confident, with 'extremely bullish' language and a '$1 trillion' opportunity framing replacing the earlier hedges. | “We continue to be extremely bullish about AV's ability to expand our market” | 1995725909 | 1 |
| New caution vocabulary about U.S. pricing entered the narrative in Q4 2024 and persisted through mid-2025 before management again described pricing as stable. | “we've also seen new dynamics resulting in overall lower prices in the U.S. market, which started late in the fourth quarter.” | 1917592366 | 3 |
| By Q1 2026 management for the first time openly acknowledged decelerating growth in its largest, oldest U.S. markets, a more cautious tone on the core business than the prior 'growth across the board.' | “I would say the industry on average is seeing slightly lower rates of growth or at least did see this past quarter.” | 1995725909 | 12 |
Across twelve quarters the through-line is consistent: management sells 'customer obsession drives profitable growth,' and its financial commitments — free cash flow, margin expansion, buybacks, the media run-rate — have largely been met or beaten. What the recent calls add to the investment debate is a growing divergence between headline gross-bookings growth, flattered by FREENOW, higher-value modes and ads, and a decelerating core U.S. ride count, alongside an AV strategy that is heavily promoted but whose economics management still declines to quantify. The bull case rests on the newer growth vectors compounding; the bear case is that the core marketplace is maturing faster than the optics suggest.
Competitors describe Lyft, Inc.'s market in their own filings and calls. These verified passages and visual pages show where their strategies meet, using source documents preserved in Sources.
Uber Technologies (UBER)
Lyft's direct rival and the far larger side of the U.S./Canada ridesharing duopoly. Uber's own 10-K names Lyft as a competitor, the two are co-defendants in driver-classification litigation, and Uber frames the autonomous-vehicle transition that is the central question for both companies.
In its FY2025 Form 10-K competition discussion, Uber lists Lyft by name among the ridesharing platforms it competes with for drivers and riders — a competitor confirming the head-to-head U.S. rivalry.
Our Mobility offering competes with personal vehicle ownership and usage, which accounts for the majority of passenger miles in the markets that we serve […] We also compete with other ridesharing companies, including certain of our minority-owned entities, for Drivers and riders, including Bolt, Didi, Lyft, and Ola.
p. 21 · Read in context →
Uber's stated view of the autonomous-vehicle threat: it names Waymo and Tesla among AV developers and warns that self-driving could sharply cut the cost of a ride, letting whoever deploys first undercut incumbents — the same disruption Lyft is exposed to.
We believe that autonomous vehicle technologies may have the ability to meaningfully impact the industries in which we compete and that autonomous vehicles present substantial opportunities. Several companies other than Aurora, including Waymo, Tesla, Zoox (a subsidiary of Amazon), Motional, Avride and Nuro, are developing autonomous vehicle technologies in the United States […] use of autonomous vehicles could substantially reduce the cost of providing ridesharing, delivery, or logistics services, which could allow competitors to offer such services at a substantially lower price as compared to the price available to consumers on our platform.
p. 30 · Read in context →
On the Q1 FY2026 call, Uber's CFO tells investors that early autonomous-vehicle adoption in San Francisco and Los Angeles has so far been expansionary for ridesharing rather than cannibalistic — the market leader's read on how AVs are affecting the shared U.S. markets Lyft also serves.
Balaji Krishnamurthy, Chief Financial Officer: we were seeing the impact of incremental AV adoption in the market as being expansionary for ridesharing in the cities in aggregate. And as Dara mentioned, our category position in these markets has also expanded over the last 6 months, which has had an accelerating impact on the sort of trajectory we're seeing there.
p. 8 · Read in context →
Alphabet (Waymo) (GOOGL)
Alphabet's Waymo runs commercial, fully driverless robotaxis in the same U.S. cities where Lyft operates, and is both a competitor and, in places, a fleet partner. Its scaling pace and Alphabet's funding are the clearest read on how fast autonomy is arriving in Lyft's markets.
Alphabet's CEO quantifies Waymo's robotaxi footprint on the Q1 FY2026 call: operations in 11 major U.S. cities and over 500,000 fully autonomous rides per week, a figure it says doubled in under a year.
Sundar Pichai, Chief Executive Officer: Waymo is on a great trajectory. It launched in Nashville a few weeks ago, that makes six new cities so far in 2026 and operations in 11 major U.S. cities in total. Waymo also surpassed 500,000 fully autonomous rides per week, doubling in less than a year.
p. 2 · Read in context →
An earlier snapshot of Waymo's city-by-city expansion — Atlanta, Austin, Los Angeles and the San Francisco Bay Area — plus testing in New York and Philadelphia, all markets central to Lyft's ride volume.
Sundar Pichai, Chief Executive Officer: Waymo continues to scale and expand to safely serve more riders in more places. Last month, Waymo launched in Atlanta, more than doubled its Austin service territory and expanded its Los Angeles and San Francisco Bay Area territories by approximately 50%. […] The Waymo driver has now autonomously driven over 100 million miles on public roads. And the team is testing across more than 10 cities this year, including New York and Philadelphia.
p. 3 · Read in context →
Alphabet discloses the capital behind the robotaxi push: a $16.0 billion Waymo investment round announced in February 2026, funded in significant majority by Alphabet — a balance-sheet depth Lyft cannot match in autonomy.
In February 2026, Waymo, a consolidated VIE, announced an investment round of $16.0 billion, the significant majority of which was funded by Alphabet.
p. 115 · Read in context →
Tesla (TSLA)
Tesla launched its Robotaxi ride-hailing service in June 2025 and explicitly positions it against traditional ride-hailing. It is a new autonomous entrant into the market Lyft serves, backed by a large vehicle fleet and FSD software.
Tesla's FY2024 10-K states its intent to launch a Robotaxi 'ride-hailing network' — a competitor declaring entry into the business Lyft operates.
In 2025, we intend to begin launching our Robotaxi business, a ride-hailing network that will eventually operate fully autonomous vehicles. We expect this business will open access to a new customer base even as modes of transportation evolve.
p. 8 · Read in context →
In its FY2025 10-K, Tesla frames its Robotaxi service as competing directly against traditional ride-hailing and taxi services — an explicit statement that it is entering Lyft's competitive set.
We expect our Robotaxi service to compete in this developing market, along with traditional ride-hailing and taxi services, through continued progress on our FSD (Supervised) and neural network capabilities, Supercharger network and infotainment offerings.
p. 20 · Read in context →
On the Q3 FY2025 call, Tesla's CFO reports the Robotaxi service is live in Austin and additional markets with the coverage area in Austin already expanded three times — evidence the entrant is operational, not just planned.
Vaibhav Taneja, Chief Financial Officer: We are now operating a robotaxi in two markets, Austin and several other cities. We have already expanded our coverage area in Austin three times since the initial launch and are on pace to continue expanding further.
p. 2 · Read in context →
More peer documents
Didi Global FY2025 annual report (Form 20-F) — 277 pages · Global ride-hailing peer (China plus 14 other countries, no U.S./Canada overlap): reports launching fully driverless robotaxi service in Guangzhou in 2025 and a co-developed AV with GAC Aion — a marker of how the worldwide ride-hailing model is moving toward autonomy. · Open →
Grab Holdings Q1 FY2026 earnings call — 24 pages · Southeast Asia superapp peer: management says it moved AV trials to 'full paying public operations' through its WeRide partnership — how another ride-hailing platform is integrating autonomy, though it does not compete in Lyft's geographies. · Open →
Alphabet FY2024 10-K — 155 pages · Discloses Waymo received $5.6 billion in funding in 2024 and is already providing fully autonomous paid ride-hailing in multiple cities — the capital and early scale behind the robotaxi threat to Lyft. · Open →
Uber Q4 FY2025 earnings call — 8 pages · Origin of Uber's 'AV is expansionary for ridesharing' framing and category-position commentary in SF/LA — directly relevant to the Uber-Lyft duopoly and the AV debate. · Open →
Tesla Q4 FY2025 earnings call — 12 pages · Management detail on Robotaxi fleet deployment, validation testing, and Cybercab ramp economics — the entrant's own view of scaling its ride-hailing service. · Open →
Didi Global FY2024 annual report (Form 20-F) — 285 pages · Earlier robotaxi milestones (DiDi Neuron concept, driverless testing) and an AV competitive-threat risk factor that mirrors Lyft's own exposure to autonomy. · Open →
Grab Holdings FY2024 annual report — 405 pages · Superapp mobility-segment economics and incentive dynamics — a business-model analogue for Lyft's marketplace, useful for benchmarking take rates and incentive intensity. · Open →
GoTo Group FY2025 annual report — 497 pages · Indonesia's Gojek on-demand mobility superapp — a marketplace analogue for Lyft with no geographic overlap; useful for how an Asian peer frames ride-hailing plus payments. · Open →
Fit — Lyft (LYFT)
Outside the framework's universe (U2 not met)
Lyft clears the geography screen — a primary US Nasdaq listing [1] — but fails the size screen: at roughly $5.9B of market value it sits about 41% below the framework's $10B floor, and a universe miss ends the fit question before any pillar is weighed. Confidence is medium. No exclusion was triggered, nothing was contested, and neither jury family split on the universe call.
Universe and exclusions
Here is the decisive point. The framework's universe is US-listed equities (no Chinese ADRs) with a market capitalization above $10B. Lyft passes the first test and misses the second.
The screen that closes the question is size, not scale. Lyft is not a small business: FY2025 revenue was $6,316.3M and gross bookings were $18.5B [2]. What falls short is the equity value: 417.659M diluted weighted-average shares at the $14.20 close (2026-07-24) is a $5.93B market capitalization — $4.07B, about 41%, below the $10B bar. The counter-fact sits in the same breath: on revenue and volume this is a large, duopoly operating business; the framework's floor is a claim about equity value, and on that measure Lyft does not clear it.
Market cap ($B)
Universe floor ($B)
Shortfall ($B)
Source: market cap derived from 417.659M shares × $14.20 (2026-07-24); share and revenue base per FY2025 10-K, Consolidated Statements of Operations [3].
None of the framework's hard exclusions is triggered — a clean screen, checked item by item.
Sources: geography and listing per FY2025 10-K cover [4]; geographic revenue split per FY2025 10-K [5]; guidance-delivery record per the Q4 FY2024 call [6]; the full treatment of each exclusion is in the Business, Durability and Self-Help tabs.
Two exclusion items are worth naming plainly even though neither triggers. Insider economic ownership is thin — all ten officers and directors hold under 1% of the shares, and CEO Risher owns about 0.27% [7] — but the promotional-CEO exclusion turns on repeated missed promises, and the delivery record is clean, so the exclusion fails on its own terms. And the FY2025 headline net income of $2,844.0M is a deferred-tax valuation-allowance release over a $188.4M operating loss [8], not cash earnings — the cash case rests on the $1,115.6M of free cash flow instead [9].
Pattern match
Of the framework's four recognition setups, Lyft most resembles the fourth — a quality tech duopoly on a fear dip, where the fear is specific and testable (here, autonomous-vehicle displacement rather than TikTok or a China quarter). It is not the first setup (no bank), the second (no dividend), or the third (no insurer repricing a mis-forecast year). The resemblance to the fourth is partial: the framework's precedents are monopolies and dominant platforms, whereas Lyft is the roughly 24% No. 2 in a two-player US market with low switching costs [10]. This is framing, not a verdict — the pattern is a lens on the setup, and the setup is moot once the universe screen fails.
The pillar ledger
The pillars are recorded here for completeness; the universe miss already closes the fit question, so none of what follows can reopen it. Each criterion is stated against its reference line, not scored.
Source: deterministic fit tally; per-criterion arithmetic traces to the FY2025 10-K [11] and the linked evidence tabs below.
Year-10 gate (P1)
The binary gate does not hold. Very-high-conviction year-10 durability of adjusted free cash flow cannot be established for a No. 2 in a low-switching-cost duopoly that owns no autonomous-vehicle technology (Level 5 was sold in 2021) and depends on AV partners who are also better-capitalized competitors — a variable Lyft's own 10-K calls a "new and evolving market, which makes it difficult to predict its acceptance, its growth" [12]. The jury's mean probability that the gate holds was 0.485, spread 0.12. The strongest surviving counter-fact: early AV adoption in San Francisco has so far been additive to ridesharing volume, and Lyft's FlexDrive fleet-operations role offers a path to participate rather than be displaced — but an additive-so-far reading is not the very-high conviction the gate demands. Full treatment in Durability.
FCF consistency (P2)
Not met — unproven rather than disproven. The deterministic 5-year rolling adjusted-FCF series is empty because there are fewer than five consecutive positive adjusted-FCF years: adjusted FCF was negative in four of the last five years, and reported free cash flow turned positive only in FY2024 [13]. The counter-fact: the turn is recent and steep — reported FCF went from -$248.1M (FY2023) to +$766.3M (FY2024) to +$1,115.6M (FY2025) [14] — so the instability is a ramp out of losses, not mature-business volatility. Either way a stable five-year average cannot yet be computed. See Yield and Durability.
Dislocation and yield (P3)
The dislocation is real but the fear gauge is muted, and the yield clears its bar on one favorable year. LYFT fell 48.5% from a $24.57 peak (2025-11-12) to a $12.65 trough (2026-03-30) — a drawdown derived from daily price data — P3a met. But sustained selling volume ran only 1.35x its trailing median and the trough printed on below-median volume, so the capitulation P3b looks for is absent; the counter-fact is a single 74.2M-share panic session on the February 11 earnings gap. On yield, FY2025 adjusted FCF of about $702.9M is an 11.9% yield on the $5.93B market cap, clearing the roughly 8-9% fortress bar — P3c met — but only on the single best year, against a three-year-average adjusted yield of 1.3%. Consensus forward FCF is a ~12-15% adjusted yield, above the bar, so the sell side already underwrites it (P3d met; jury probability 0.675, spread 0.05). Full anatomy in Dislocation and Yield.
Balance sheet and self-help (P4)
The balance sheet passes; capital allocation fails the framework's hard rule. Lyft is net cash — net debt of -$79.0M, $1,837.2M of liquidity against $1,053.0M of near-zero-coupon convertibles with nothing material due before 2029 [15] — a fortress that can outlast the dislocation without ever prioritizing debt paydown (P4a met). But the framework fails outright any company whose share count keeps rising, and Lyft's diluted weighted-average shares grew 84% from 227.5M (2019) to 417.7M (2025), a 6.0% five-year CAGR driven by stock-based compensation [16] — P4b not met. The counter-fact is a genuine FY2025 inflection: point-in-time Class A shares issued fell from 409,474K to 400,856K after $500M of buybacks [17], the first annual decline — but the multi-year trend still reads rising, and P4c (dividend cover) is not applicable because Lyft pays no dividend. Full treatment in Self-Help.
Diagnosis (P5)
The adversarial trial put the probability the impairment is temporary at 0.62 — a lean toward temporary that this report carries and cannot override. The three blind judges landed at 0.62, 0.43 and 0.64 (mean 0.563, spread 0.21); the harness does not flag the ruling as contested. The dated near-term hit was a single non-recurring item: a $210M legal, tax and regulatory reserve, $168M of it reducing Q4 2025 revenue, on a quarter that still set records for profit and cash and reaffirmed the 2027 targets [18]. The counter-fact sits inside the same ruling: one seat at 0.43 leaned permanent, so meaningful one-in-three weight rests on the possibility that rising, non-discretionary insurance cost per mile is a structural margin drag rather than a passing item. Both cases are laid out in Damage Math.
Instrument context (I1)
Resolves not verifiable. Long-dated listed options exist on LYFT — expirations to December 2027 and January 2028, deep open interest of roughly 656,000 contracts — so the framework's watchlist-only-by-instrument consequence is not triggered; and 30-day implied volatility of about 76% sits above the framework's 60-70 reference band. These facts rest on web aggregators (AlphaQuery, Market Chameleon) dated 2026-07-23 with no in-corpus filing to cite, so the criterion is recorded as not verifiable rather than met. Detail in Clock.
Re-rating arithmetic
The framework's target test asks what price a bar-yield on normalized adjusted free cash flow implies, and how far consensus would have to move to get there. The deterministic re-rating math is unavailable here: the applicable fortress bar is 8.5%, but normalized adjusted FCF is not_computable in the feature file (the structured cash-flow feed carried no capex, SBC or acquisition lines), so neither the implied market cap at the bar nor the upside to it can be shown without improvising the numerator. That gap is stated, not filled.
What the tabs can offer is orientation, clearly caveated. On the single most favorable year, adjusted FCF of about $702.9M against the 8.5% bar would support roughly $8.3B of equity value — above today's $5.93B but below the $10B universe floor — and a transparent DCF on consensus FCF puts enterprise value near $16.4B at a 10% discount [19]. Both figures lean on a FY2025 cash base flattered by roughly $0.8B of insurance-reserve working-capital build, which the Yield tab normalizes. For base rates, Lyft's own turnaround-era history shows four drawdowns of 46-55% since 2023, three of which round-tripped to their prior peak within 10-18 months — encouraging, but a small single-regime sample, and the pre-2023 regime shows the opposite: a roughly 90% de-rating from the 2019 IPO that never recovered (Clock).
Contested and undetermined
Nothing was contested: the tally records no criterion with both readings live, and the trial ruling is not flagged contested. Nothing was marked cannot-determine. One criterion, I1 (instrument context), resolves not verifiable — its facts rest on web aggregators rather than a filing — and P2 (FCF consistency) is best described as unestablished rather than failed, because fewer than five consecutive positive adjusted-FCF years exist to average. Neither reopens the universe result.
Provenance
Source: deterministic fit tally, provenance block (jury composition, order-stability, mask-divergence and skeptic counts).
Two model families, four seats plus a masked probe, agreed unanimously on both universe criteria, so the finding that closes this report was not a close call. The verdict was pressed on the pillars — a skeptic pass that refuted none of the 16 fully-checked claims and a name-mask probe that moved no gate — but because the universe screen is categorical, that pressure changed nothing about the answer.
The falsifier ledger
These are the standing conditions that would change the framework read if the universe question were ever reopened (for example, if the equity re-rated back above the $10B floor). Several restate the same threshold from different tabs; each is recorded verbatim.
- adjusted FCF or EBITDA declines where flat-or-better was underwritten
- revenue declines for a third consecutive year
- capital allocation pivots to debt paydown over repurchases
- share count inflects upward
- the industry repricing cycle fails to materialize where industry-wide mean reversion was underwritten
- Gross bookings decelerate below ~10% for two consecutive quarters, converting a priced de-rating into demonstrated demand impairment.
- Insurance cost-per-mile keeps compressing revenue margin AND adjusted EBITDA margin stalls or falls below FY25's 2.9%, breaking the 4%-by-2027 path.
- Documented U.S. rideshare share loss to Uber/AV entrants, contradicting the 'network partner' framing.
- 2027 targets ($25B GB, 4% EBITDA, >$1B FCF) missed or withdrawn, or FCF ex-insurance-float turns down.
- Through Q2-Q4 2026, insurance cost per ride declines outside California and insurance reserves/accruals stop being the primary working-capital driver.
- Through Q2-Q4 2026, high-teens bookings growth persists while incentive-program costs and sales and marketing as a percentage of revenue decline.
- FY2027 targets of $25B gross bookings, 4% adjusted EBITDA margin, and over $1B FCF are achieved with positive GAAP operating income and without material legal, tax, or regulatory add-backs.
- Lyft shows stable or rising share in Uber/AV-overlap markets without revenue-margin compression.
- Bookings/Rides decelerate below ~10% or turn negative for two consecutive quarters (next prints ~Aug and ~Nov 2026), converting a price event into a demand event.
- Insurance reserve build reverses and TTM FCF falls below ~$0.9B, showing the $829M working-capital tailwind was a one-time flatter rather than a recurring float dynamic.
- Documented U.S. rideshare share loss to AV/Uber, or GAAP operating loss keeps widening ex-legal/regulatory charges (insurance/incentives absorbing scale structurally).
- 2027 targets ($25B GB, 4% EBITDA margin, >$1B FCF) withdrawn or clearly missed at/after FY2026 results.
Data gaps
The run could not answer several things the fit rests near, from the tally's list:
- Framework adjusted FCF, adjusted-FCF yield, the yield baseline and the 5-year FCF-stability series are all
not_computablein the feature file — the structured cash-flow feed omitted capex, SBC and acquisitions, so every FCF figure here is reconstructed from the filed consolidated cash-flow statements and should be treated as an estimate. - Market cap in the feature file uses 417.7M diluted weighted-average shares; period-end shares were 400.9M after FY2025 buyback retirements, so true current market cap is nearer $5.69B and the yields are marginally higher than reported — but still far below the $10B floor.
- Precise, current (July 2026) US rideshare market shares are not in the corpus; the ~76%/~24% split is Bloomberg Second Measure's March 2024 reading.
- The official short-interest feed returned zero rows; the ~24%-of-float short-interest level is from publicly reported bi-monthly data via web, not the corpus.
- Implied-volatility and options open-interest figures are web-sourced (AlphaQuery, Market Chameleon, 2026-07-23); the run's own web-research phase failed on a billing error, so the I1 facts rest on external aggregators rather than a filing.
- No independent market-share time series is in the corpus to test the AV/Uber displacement premium that the residual price-vs-value gap represents; the trial's flip conditions name it as the decisive future evidence.
Business
Lyft is the number-two ridesharing marketplace in the United States — roughly a quarter of U.S. rideshare spending against Uber's three-quarters — an asset-light, net-cash platform that booked $18.5 billion of gross bookings and $6.3 billion of revenue in FY2025, about 96% of it domestic. It clears the U.S.-listing screen cleanly but misses the framework's universe bar of more than $10 billion at a market capitalization near $5.9 billion. No China dependence; not a consensus darling. A duopoly by scale, not by regulation, with a roughly 13-year operating history.
What Lyft is
Lyft operates a two-sided transportation marketplace: its app matches riders with drivers for on-demand rides, and layers on bikes, scooters, taxis, private-hire and chauffeur services, advertising (Lyft Ads), enterprise (Lyft Business) and vehicle rentals. Management now describes it as a "global mobility platform," and states that substantially all revenue comes from the ridesharing marketplace — service fees and commissions charged to drivers for use of the network [1]. Two sentences for a cold reader: Lyft rents access to a rider-and-driver network and keeps a cut of each fare; it owns almost no vehicles, so its economics are those of a marketplace, not a fleet operator.
The scale of that network, on FY2025 figures:
Revenue ($M, GAAP)
Gross Bookings ($M)
Active Riders, Q4 (M)
Rides, FY (M)
Adj. EBITDA ($M)
Free Cash Flow ($M)
Sources: total GAAP revenue, Consolidated Statements of Operations [2]; gross bookings, rides, active riders, Adjusted EBITDA and free cash flow, MD&A key metrics [3].
Revenue ran $6,316.3 million in FY2025, up about 9% year on year; gross bookings — the total value of transactions on the platform — were $18,507.0 million, so Lyft's reported revenue is roughly a 34% "take" on bookings [4] [5]. One reconciliation matters for anyone comparing figures: that $6,316.3 million is the sum of $5,895.5 million of revenue from contracts with customers (ASC 606) and $420.8 million of vehicle-rental revenue (ASC 842); the profile's feature file tracks the ASC 606 line, so its revenue series runs about $421 million below the GAAP top line [6].
One line item colours the whole income statement. FY2025 net income of $2,844.0 million is not an operating result — the company reported a $188.4 million loss from operations and swung to a positive bottom line only through a $2,897.3 million income-tax benefit, the release of a deferred-tax valuation allowance [7]. The cash story is stronger and independent of that mark: operating cash flow was $1,168.4 million and company-defined free cash flow $1,115.6 million [8]. The framework's own adjusted-FCF yield is computed in Yield; this tab only flags that headline "profit" is a tax artifact, not operations.
The growth shape
Source: revenue from contracts with customers (ASC 606), per the profile feature file (fit_features.revenue_trajectory), derived from Lyft 10-K filings FY2017–FY2025; total GAAP revenue adds vehicle-rental revenue (about $421M in FY2025) [9].
The trajectory shows one pandemic collapse (FY2020, revenue down 36%) and otherwise growth every year, with a step-up in FY2024. There is no three-year run of high-single-digit decline; the framework's structural-decline disqualifier is not triggered on the revenue line — the feature file records zero consecutive decline years. That said, growth has decelerated to single digits (about 9.9% on the ASC 606 basis in FY2025), and the recent reacceleration in gross bookings owes partly to the mid-2025 European acquisitions rather than organic domestic volume.
Where the revenue comes from
Even after Lyft entered nine new countries and 180-plus cities by acquiring the European multimodal app Freenow (July 2025) and the global chauffeuring firm TBR (October 2025) — extending the platform to "thousands of cities across six continents" [10] — the business is still overwhelmingly domestic. FY2025 revenue split $6,060.2 million United States versus $256.0 million international, so about 96% is U.S.-sourced and roughly 4% international, the latter mostly a partial-year contribution from the new European operations [11].
Source: FY2025 Annual Report, Note 3 Revenue — geographic disaggregation [12].
China exposure (S1): none. Lyft's markets are the United States and Canada plus, since mid-2025, Europe; there is no China revenue and no China-based assets disclosed. The auto-selected peer set in this run includes DiDi (China), Grab (Singapore) and GoTo (Indonesia), but those are not Lyft's operating markets — its own filing names Uber, Bolt and AV developers as its competitors, all in North America and Europe. The China-dependence sensitivity flag does not apply.
Market structure and moat
The U.S. ridesharing market is a duopoly. Lyft's 10-K names Uber as its main ridesharing competitor and Uber and Bolt as its main rivals for app-based taxi and private-hire intermediation [13]. On the most recent published third-party spending data, Uber holds about 76% of U.S. rideshare spending and Lyft about 24%, a split that has been broadly stable — Uber's share has moved in a 68–76% band since 2017.
Source: Bloomberg Second Measure, U.S. rideshare spending (observed), most recent published reading (March 2024); Lyft names Uber and Bolt as its principal competitors [14].
For the durability question the jury and Durability will weigh, the structure cuts two ways, and both belong on the record:
- In favour of durability: rideshare demand is essential-adjacent and recurring (945.5 million rides in FY2025), and the market is a two-player scale game rather than a fragmented commodity, which limits the number of credible attackers.
- Against durability: the moat is scale and network density, not regulation or capital. Lyft itself states that within these markets "the cost to switch between products is low," that riders gravitate to the cheapest or highest-quality option and multi-home, and that "our market share has fluctuated over time," forcing price cuts that hurt near-term results [15]. The framework prizes regulatory entry barriers (banks, insurers), capital intensity as a moat, and 30–50-year operating histories. Lyft has none of these: it is capital-light and owns almost no vehicles, there is no licensing regime that keeps a well-funded rival out (Uber, Bolt and Waymo all compete freely), and it has operated as Lyft only since 2012 — roughly 13 years [16]. Autonomous-vehicle developers, chiefly Alphabet's Waymo, are a named emerging threat to the human-driver model on which today's economics rest.
The company is small in headcount for its reach — 3,913 full-time employees worldwide at year-end 2025 — consistent with an asset-light, technology-run marketplace rather than a labour- or capital-heavy operator [17]. The balance sheet is a fortress on the framework's own definition: net cash of roughly $79 million (about $1.13 billion of cash plus $0.71 billion of short-term investments against its convertible notes) [18]. That net-cash position is a survivability strength, but it also means capital intensity is not doing the defensive work the framework looks for in a durable essential.
The universe screen
Listing (U1): clean. Lyft is a Delaware-incorporated, U.S.-domiciled company whose Class A common stock trades on the Nasdaq Global Select Market under the symbol LYFT — a primary U.S. listing, not a foreign ADR and not a Chinese issuer [19]. It sits inside the framework's geographic universe.
Size (U2): a miss. The framework's universe requires a market capitalization above $10 billion. Lyft's is roughly $5.9 billion — 417.7 million shares at $14.20 on 24 July 2026 — a little over half the bar, and web sources across the same week put it in a $5.4–5.9 billion range.
Market Cap ($B)
Universe Bar ($B)
Source: market cap derived from fit_features.market_cap (417.66M shares times $14.20 close, 24 Jul 2026); corroborated by public market-data sources for July 2026.
At about $5.9 billion, the gap is not marginal — it would take roughly a doubling of the equity value for Lyft to enter the universe. The screen is a factual gate, not a judgment on the business; where it leaves the fit answer is carried by Fit.
The exclusion screen
- Auto-OEM (X1): does not apply. The framework's car-company exclusion targets vehicle manufacturers with excess capacity and undifferentiated products. Lyft manufactures nothing and owns almost no fleet — it is a marketplace that intermediates rides, so the OEM screen is not triggered [20]. The genuine adjacency worth naming is that its unit costs move with auto and insurance inflation, and that the eventual shift to autonomous vehicles is a capital-heavy race it does not lead.
- Consensus darling (X4): does not apply. A darling is where the whole market already owns the story on an extreme multiple. Lyft is the opposite: it trades at roughly 0.9 times sales ($5.9 billion market cap on $6.3 billion revenue) and sits more than 40% below its November 2025 high of $24.57, having fallen as far as 48% to a March 2026 trough. Uber is the premium, widely-owned name in this pair — roughly $145 billion market cap on about $53.7 billion revenue, near 2.7 times sales. On the framework's terms Lyft is the cheaper, out-of-favour twin, not the saturated consensus long.
Source: Lyft market cap per fit_features and revenue per FY2025 10-K [21]; Uber figures from public market-data sources, July 2026.
One exclusion-relevant fact this tab surfaces without owning it: Lyft's share count keeps rising — 417.7 million shares outstanding in FY2025 against 227.5 million in FY2019, a roughly 6% five-year compound increase driven by stock-based compensation, only partly offset by a $500 million buyback begun in FY2025. The framework treats a structurally rising share count as a hard problem for the buyback-flywheel case; the buyback-versus-dilution arithmetic and management's capital-allocation intent belong to Self-Help, and the promotional-CEO check (X2) is run there and in Durability. It is noted here only so the reader meets it early.
Dislocation
There is a real dislocation here — a 48.5% peak-to-trough fall in five months — but its shape is unusual on two counts the framework cares about. The dated trigger is the February 10, 2026 fourth-quarter print, whose headline 9% revenue miss was roughly $168 million of one-time reserve changes on a quarter that also set records for profit and cash. And the price fell far ahead of the numbers: through the drawdown, consensus forward earnings estimates rose about 14% while sustained selling volume ran only 1.35x its trailing median.
The drawdown, quantified
Peak — 12 Nov 2025
Trough — 30 Mar 2026
Current — 24 Jul 2026
Peak-to-Trough
Source: derived from the daily price series; figures match fit_features.capitulation_gauge.drawdown (peak $24.57 on 2025-11-12; trough $12.65 on 2026-03-30; 138 days).
Source: daily closing prices, as reported; peak, trough and current dates per fit_features.capitulation_gauge.
The fall came in three distinct segments rather than one clean break. From the November 12 peak of $24.57 the stock drifted to about $16.85 by February 10 — a 31% decline over three months on ordinary volume and with no single dated catalyst, the multiple compressing as autonomous-vehicle disruption fear repriced the whole rideshare complex. The framework treats this first leg as drift, not the moment: a stock down 10-30% with no event and normal volume is the slide, not the capitulation. The event leg was February 10-12, when the fourth-quarter print took the stock from $16.85 to $13.05 — a 22.6% two-session fall. The stock then bled to its trough of $12.65 on March 30 on light volume, and has since recovered to $14.20, still 42.2% below the peak and 12.3% above the trough.
The trigger
The dated adverse event is Lyft's fourth-quarter and full-year 2025 report, released after the close on February 10, 2026; the stock fell 17.0% the next session, from $16.85 to $13.99. The report was, in its own words, a record on most axes — gross bookings grew "19% year on year" and accelerated, the company "printed over a billion dollars in cash" [1], and the year closed "with 51.3 million riders taking 946 million rides" [2]. What the tape reacted to was the top line: reported revenue of about $1.59 billion came in roughly 9% below the ~$1.75 billion consensus.
Most of that gap was a single non-recurring item. The CFO told the call the quarter carried "a one-time impact of totaling about $210 million under the category of certain legal tax and regulatory reserve changes," of which "$168 million of that $210 million impacted revenue," so that without it "our revenue would be closer to $1.8 billion" — in line with the prior quarter's revenue margin [3]. Guidance was not cut: management guided first-quarter gross-bookings growth "accelerating at the high end" with margin in line with the prior year [4], and reaffirmed the 2027 targets of $25 billion gross bookings, a 4% adjusted-EBITDA margin, and over $1 billion of free cash flow [5]. Whether a one-time reserve-driven revenue miss justifies a permanent repricing is the temporary-versus-permanent question the Damage Math tab decides; this tab only fixes what fell and when.
The event leg is February 10-12, 2026 (Q4 print, revenue 9% below consensus, ~$168 million of it a one-time reserve item). The preceding 31% fall from the November peak was drift on ordinary volume with no single dated catalyst.
The fear gauge
The capitulation signal is muted. The deterministic gauge measures a volume spike of 1.35x — the peak 20-day average volume during the fall divided by the median daily volume over the 180 days before the peak (about 16.1 million shares), per fit_features.capitulation_gauge.volume_spike. A 1.35x sustained multiple is closer to orderly repricing than to an emotion-driven flush.
Source: daily traded volume, as reported; median pre-peak volume of ~16.1M shares per fit_features.capitulation_gauge.volume_spike.
Where the volume did concentrate is telling. The one true panic day was February 11, when 74.2 million shares traded — 4.6x the pre-peak median — as the earnings gap forced anchored holders out. But that spike was a single session inside an otherwise ordinary tape: the earlier drift from the peak ran at 10-20 million shares a day, and the March 30 trough itself printed on just 11.4 million shares, below the median. Peak fear, in the framework's sense, showed up for one day on the trigger and did not sustain into the low. The selling exhausted quietly rather than in a flood.
Who was selling
Lyft carries a large, structural short base. Publicly reported short interest stood at 89.6 million shares — 23.8% of float — at the July 15, 2026 settlement, down about 2% from 91.5 million on June 30; the level has run near a quarter of the float through the drawdown, roughly double the ~12.7% average of its peer group. Days-to-cover sit around 3.5-9 depending on the volume window used. This is a stock the disruption bears have been positioned against for some time, not one where a fresh, forced seller appeared.
Insider behavior points the other way, on small size. Across the drawdown window there were no forced or liquidation sales; the only sizable insider disposition was a director's roughly $3.9 million sale on December 4, 2025 at about $22.30 — before the event leg, near the top of the drift. CEO David Risher, by contrast, has bought roughly $100,000 of stock in the open market each quarter, and added again on February 13, 2026 — two days after the crash — purchasing 7,490 shares at $13.38. The composition of the selling is therefore a heavy anchored/short base and index-priced multiple compression, not disclosed informed insiders heading for the exit.
Insider figures per SEC Form 4 filings; short-interest figures per publicly reported bi-monthly short interest (settlement date July 15, 2026). Neither has a source PDF in the corpus.
Estimates versus price
The framework's signature is a price fall that outruns the estimate cut. Here the price did not merely outrun the estimates — it moved opposite to them. Over the roughly six months spanning the drawdown, consensus forward EPS rose about 14% while forward revenue was essentially flat, even as the shares fell 42-49%.
Source: CapIQ estimate snapshots, data/sp/estimates.json momentum series (as-of 2026-01-25 vs 2026-07-24); price change is peak (12 Nov 2025) to current (24 Jul 2026), per fit_features.
The consensus forward cash-flow numbers say the same thing from the other direction: the sell side models roughly $1.13 billion of free cash flow for FY2026 rising to about $1.29 billion by FY2027 — an 18-22% forward yield on the current $5.93 billion market capitalization (fit_features.consensus_forward_yield). Estimates did not fall before, with, or after the price; they held or rose while the multiple compressed. Whether that forward yield clears the framework's balance-sheet-scaled bar is worked in the Yield tab, and the gap between the earnings change and the price change is quantified in Damage Math.
What this tab establishes
The dislocation is genuine in magnitude — down 48.5% peak-to-trough, 42% from the peak today — and it has a clean, dated trigger in the February 10 revenue miss, most of which was a one-time reserve item on a record-profit, record-cash quarter. Two features complicate the classic setup, and both are stated here without diagnosis. The fear gauge is weak: sustained volume ran 1.35x its median, with a single 4.6x panic day and a low-volume trough. And the price moved independently of the numbers, falling more than 40% while forward earnings estimates rose about 14% — an estimate-independent multiple de-rating carried by a large, elevated short base rather than by forced informed sellers. Where the November-to-February drift sits relative to the February event leg, and whether the de-rating is temporary or permanent, are carried into the Damage Math and Clock tabs.
Damage Math
The market erased about $4.33 billion of Lyft's equity value from the November 2025 peak, a 42% cut. Over the same window consensus forward EPS rose roughly 14% and forward revenue held flat, so the fundamental numerator behind the move is close to nil. A transparent two-scenario DCF sizes plausible value destruction at $0.3 billion if the hit is temporary and about $4.33 billion if permanent; the trial weights those at a probability the impairment is temporary of 0.62, leaving a residual gap near $2.5 billion that is priced multiple, not lost cash.
The near-term hit — the numerator
The trigger was the February 10, 2026 fourth-quarter print. Reported Q4 2025 revenue was $1,593 million against consensus of $1,755 million — a 9.2% shortfall [1]. The entire shortfall is one line: the full-year filing states revenue was reduced by a "$168 million impact from certain legal, tax, and regulatory reserve changes and settlements, which were recorded as a reduction to revenue" [2]. Add that $168 million back and Q4 revenue is $1,761 million — essentially the consensus number. On the same print, normalized EPS beat, $0.366 against $0.316, a 16% upside surprise.
Gross bookings tell the same story from the volume side: Q4 2025 bookings were $5,074 million, up 19% year over year and accelerating [3]. Nothing about demand broke; a one-time reserve was recorded against the revenue line.
The clearest test of whether earning power was impaired is what the analysts who follow the name did to their forward numbers. They raised them. Six months before today — a snapshot dated January 25, 2026, before the trough — consensus FY2027 normalized EPS was $1.83; today it is $2.09, up 13.9%. FY2028 EPS moved $1.86 to $2.12, up 13.6%. Forward revenue barely moved: FY2027 slipped 0.7% and FY2028 slipped 1.3%.
Source: consensus estimate revisions, S&P Capital IQ estimate momentum (data/sp/estimates.json), 180-day snapshot vs current; EPS in $, revenue in $M.
The near-term hit that drove a 42% de-rating, measured in the currency the whole tab rests on — dollars of forward cash flow — is not a cut. The forward EPS stream is higher now than before the sell-off began. The only genuinely soft print since was Q1 2026, where normalized EPS came in $0.285 against $0.292 consensus, a 2.3% miss, while revenue beat by 1.1% — a rounding-scale variance, not a demand event.
The price and EV change — the denominator
Against a numerator of roughly nil, the price moved a great deal. The shares fell from $24.57 on November 12, 2025 to a $12.65 trough on March 30, 2026 — a 48.5% peak-to-trough drawdown over 138 days — and sit at $14.20 today [fit_features:capitulation_gauge]. On 417.659 million shares that is a market-cap move from $10.26 billion at the peak to $5.93 billion now, an erasure of $4.33 billion, or 42% [fit_features:market_cap]. With net cash of $79 million the enterprise value is fractionally lower than the market cap at every point, so the EV move is the same $4.33 billion [fit_features:balance_sheet_class].
Source: consensus revisions (data/sp/estimates.json); price and market-cap moves derived from fit_features.json (capitulation_gauge, market_cap), price as reported. The 1.35x volume spike on the drawdown marks capitulation, not a structural repricing [fit_features:capitulation_gauge].
The move is inverted in signature: the estimates that price is supposed to discount rose while the price fell by nearly half. That does not by itself prove a mispricing — the market may be discounting an impairment the analysts have not yet cut for — but it does establish that the fall was not a response to a fall in near-term earnings. It is a change in the multiple applied to those earnings.
The NPV arithmetic — two scenarios, workings visible
A de-rating is only a mispricing if the value of the forward cash flows exceeds the price by more than the plausible damage. Here is a deliberately simple discounted-cash-flow on consensus mean free cash flow, so every number is on the page. Discount rate 10%; terminal growth 3% applied to the final explicit year; net cash added back at the end.
Source: consensus mean free cash flow FY2026–FY2029 (data/sp/estimates.json, mirrored in fit_features.consensus_forward_yield); present values computed at r = 10%.
The four explicit years present-value to $3.91 billion. The terminal value at the end of FY2029 is $1,247.9M × 1.03 / (0.10 − 0.03) = $18.36 billion, worth $12.54 billion today. Enterprise value is $3.91B + $12.54B = $16.45 billion; adding $79 million of net cash gives equity of about $16.53 billion, or roughly $39.6 per share against the current $14.20. Hold the growth assumption and lift the discount rate to 12% and the enterprise value still computes to about $12.8 billion — more than twice the current $5.93 billion market cap. On consensus figures the post-crash price already embeds a wide margin of safety.
That intrinsic estimate is the temporary reading: consensus cash flows, intact and rising. The damage question is how much of that value the near-term hit plausibly destroys under each diagnosis.
Temporary. The hit is the one-time $210 million legal, tax and regulatory reserve, of which $168 million reduced revenue. Present-valued as a single year of foregone cash, that is about $0.3 billion of NPV. The forward stream is unchanged — consensus for it rose. NPV damage: roughly $0.3 billion.
Permanent. The Q4 shock exposed a lower-quality cash engine, and durable free cash flow is structurally lower. For the erased $4.33 billion to reflect lost value rather than a lower multiple, the durable FCF stream must sit permanently about 26% below the consensus path ($4.33B / $16.45B EV). NPV damage: roughly $4.33 billion.
Source: price damage = market-cap decline peak-to-current, derived from fit_features.json; NPV damage from the two-scenario DCF above; trial weights from ruchir/trial/tally.json.
The gap is the whole point of the tab. If the impairment is temporary, fundamental damage explains about $0.3 billion of a $4.33 billion price move — roughly 93% of the fall is multiple, not cash. If it is permanent, the price move is warranted and there is no gap. Weighting the two scenarios by the trial's probability the impairment is temporary of 0.62 gives plausible NPV damage of 0.62 × $0.3B + 0.38 × $4.33B = $1.83 billion, and a residual gap of $4.33B − $1.83B = $2.50 billion — about 58% of the price move that neither scenario's fundamental damage accounts for. That residual is the price of autonomous-vehicle displacement fear, expressed as a lower multiple rather than a lower forecast.
The trial — temporary versus permanent, at strength
The temporary-versus-permanent question was argued by two opposing corpus-cited briefs and ruled on by three independent judges. Both cases are real; the strongest evidence on each side follows.
The panel ruled the probability the impairment is temporary at 0.62. The three seats landed at 0.62, 0.43 and 0.64 — a range of 0.43 to 0.64 and a mean of 0.56, with a small 0.085 gap between the temporary-first and permanent-first reading orders; the tally is not flagged contested [tally:p_temporary]. One permanent-first judge sat below even odds, so the reading is a lean, not a consensus. That 0.62 is the probability the report carries; this tab's arithmetic is weighted by it and does not override it. What would move it, per the ruling: gross bookings decelerating below ~10% for two consecutive quarters, insurance cost-per-mile continuing to compress revenue margin while the EBITDA-margin path stalls, or documented U.S. rideshare share loss to Uber or AV entrants.
Which line broke — and whether it self-corrects
The driver behind the hit is the revenue margin — Lyft's take rate on gross bookings. In Q4 2025 revenue was 31.4% of gross bookings ($1,593M / $5,074M), down from 36.2% in Q4 2024 ($1,550M / $4,279M); stripping the $168 million reserve lifts the Q4 2025 figure to 34.7%, still below the prior year [13]. For the full year revenue was 34.1% of the $18,507 million of gross bookings [14].
Source: quarterly revenue and gross bookings, Q4 FY2025 earnings presentation p.10 [15]; take rate = revenue / gross bookings, derived.
The compression has a repricing mechanism working in its favor. The squeeze came from insurance cost per mile, and Lyft expects total insurance costs to "continue to increase at a lower rate than they have historically as a result of California's rideshare insurance reform bill, SB 371," which lowered cost per mile in its largest state [16]. If insurance reprices and incentive intensity normalizes, the take rate recovers and the temporary reading holds.
The structural counter is that insurance is non-discretionary — cost of revenue "primarily includes insurance costs" — so each incremental ride carries a regulated cost that scales with volume, and the Q1 2026 doubling of incentives is not a one-quarter accounting event [17] [18]. Set against Uber's scale in the same market, that is the case for a permanent haircut rather than a passing squeeze. The trial weighed both and landed on the lean above; the arithmetic on this page — a residual gap near $2.5 billion at that weighting — is what the diagnosis has to be right about for the price to be right.
The forward cash yield that this de-rating created is treated in the Yield tab; the anatomy of the drawdown itself in Dislocation.
Yield
On the framework's adjusted basis — reported free cash flow minus stock-based compensation minus the five-year average of acquisition spend — Lyft's FY2025 adjusted FCF works out to roughly $703M, an 11.9% yield on the $5.9B market cap that clears the ~8–9% fortress bar. That reading rests on one year. The three-year average adjusted yield is ~1.3%, adjusted FCF was negative in four of the last five years, and the FY2025 figure leans on a ~$479M insurance-reserve build that, normalized, pulls the yield toward 4–8%.
The deterministic feature file could not compute adjusted FCF: the structured cash-flow feed carried operating cash flow but omitted capex, stock-based compensation, and acquisitions, so fit_features.adjusted_fcf is empty (not_computable). Every figure below is reconstructed directly from the filed consolidated statements of cash flows, line by line, with the workings shown.
The adjustment, line by line
The framework starts from Lyft's own free-cash-flow definition — operating cash flow less purchases of property, equipment, and scooter fleet — then removes two items the reported number flatters: stock-based compensation (a real cost paid in shares, not cash) and lumpy acquisition spend, smoothed to a five-year average.
Adjusted FCF = reported FCF − SBC − 5-yr average acquisitions; derived from company filings. Operating cash flow, capex, SBC, and acquisitions from the FY2025 10-K Consolidated Statements of Cash Flows [1] and FY2023 10-K for FY2021–FY2022 [2]; reported FCF cross-checks the company's own reconciliation [3].
Two facts drive the whole tab. First, reported FCF only turned positive in FY2024 — the three prior years were negative ($-180.9M, $-352.3M, $-248.1M) [4]. Second, SBC is the dominant adjustment: $322.3M in FY2025, down from $724.6M in FY2021 but still nearly a third of reported FCF [5]. The five-year-average acquisition figure is $90.4M — the average of a near-zero FY2021, $146.3M for the 2022 PBSC/other deals, small FY2023–FY2024 amounts, and $307.3M in FY2025 for the Freenow and TBR purchases [6][7].
The gap between the reported line and the adjusted line is the point of the exercise: on a five-year average, adjusted FCF is roughly $-393M — negative — because the SBC drag exceeded cash generation in every year through 2023.
Reported FCF per company filings; adjusted FCF = reported FCF − SBC − 5-yr avg acquisitions, derived from company filings [8][9].
The yield, three ways
FY2025 Adjusted Yield
3-Yr Avg Adjusted Yield
FY2025 Adjusted FCF ($M)
Adjusted FCF ÷ market cap of $5.93B (417.7M shares × $14.20, 2026-07-24). Derived from company filings and the price feed; market cap per fit_features.market_cap.
Current. FY2025 adjusted FCF of $702.9M on the $5.93B market cap is an 11.9% adjusted yield.
Three-year average. Averaging FY2023–FY2025 adjusted FCF ($-823.0M, $345.0M, $702.9M) gives $75.0M, a 1.3% yield — the deeply negative 2023 drags the mean far below the current-year figure.
Baseline distribution. There is none to speak of. A fortress name in this framework shows a stable multi-year yield baseline — Microsoft's steady ~4% before an AI scare pushed it toward 9% — and the signal is a jump off that stable line. Lyft has no positive adjusted-FCF baseline: the series is negative in FY2021–FY2023 and only crosses zero in FY2024. fit_features.yield_baseline is not_computable for exactly this reason. So the 11.9% is not a fortress name dislocating off a stable baseline; it is a company that reached positive real FCF for the first time two years ago.
Which bar applies
The balance sheet selects the reference line. Lyft is net cash. Total debt is the $50.6M current portion plus $1,002.4M of long-term convertible notes, against $1,132.0M of cash and equivalents [10]:
Net debt = total debt − cash and equivalents; matches fit_features.balance_sheet_class.net_debt (−$79.0M). Balance-sheet lines from the FY2025 10-K [11].
Net debt of $-79.0M satisfies the fortress rule (net debt at or below zero), so fit_features.balance_sheet_class reads fortress and the reference line is ~8–9%. Adding the $705.2M of short-term investments widens the net cash position to roughly $784M. One caveat sits behind the label: a large share of Lyft's cash is restricted — $705.4M of restricted cash and equivalents at year-end, pledged mainly as insurance collateral [12] — and current liabilities carry sizable insurance reserves. The net-cash classification holds, but it is not an unencumbered fortress balance sheet.
In plain arithmetic: 11.9% on FY2025 adjusted FCF against the ~8–9% fortress bar clears it by roughly 290–390 bps. On the three-year average, 1.3% against 8–9% falls short by roughly 670–770 bps.
Normalizing the float
Lyft is not a classic cyclical whose current FCF is trough-depressed; if anything the opposite. FY2025 is the best cash year in the company's history, and it is inflated by a working-capital tailwind that will not repeat at this size every year: the insurance-reserve build contributed $479.0M to operating cash flow in FY2025 [13]. Reserve growth is real cash while the book grows — insurer-style float — but it swings: over FY2021–FY2025 the contribution was $81.6M, $348.7M, $-79.5M, $363.5M, and $479.0M, a five-year average of $238.7M and a FY2023 that was a $79.5M drag.
Normalizing the float to its own five-year average, rather than the FY2025 peak, is the honest adjustment. The assumptions are stated so a skeptic can recompute under an adjacent window:
Moderate subtracts the $240.3M by which FY2025's $479.0M insurance-reserve build exceeded its 5-yr average ($238.7M); aggressive strips the full $479.0M. Insurance-reserve figures from the FY2025 and FY2023 10-K cash-flow statements [14][15].
Under the moderate normalization the adjusted yield is ~7.8% — just under the 8–9% bar. Under the aggressive one it is ~3.8%. The headline 11.9% clears the bar; a version that does not lean on a peak float year does not, or barely.
The consensus check
CapIQ consensus (pulled 2026-07-24) has free cash flow — the closest vendor proxy to Lyft's own FCF definition, and near the FY2025 actual of $1,115.6M against a $1,088.0M estimate — rising across the forecast: $1,127.3M for FY2026, $1,289.4M for FY2027, then holding near $1.25B [16]. On the current market cap those are 19.0%, 21.7%, and ~21% yields. That vendor metric does not remove SBC, so it is the reported-FCF basis; subtracting the framework's SBC-plus-acquisition adjustment ($412.7M) brings the forward figures to a ~12–15% adjusted yield.
Consensus free cash flow from CapIQ estimates (data/sp/estimates.json, pulled 2026-07-24), on current market cap of $5.93B; adjusted line subtracts $412.7M (FY2025 SBC $322.3M + 5-yr avg acquisitions $90.4M). Bar shown at the midpoint 8.5%.
Even on the adjusted basis, consensus forward FCF clears the ~8–9% fortress bar in every forecast year. Under the framework's consensus rule that reads as the sell side already agreeing: the setup would be fear rather than a fundamentals collapse. The path back above the bar is not a mean-reversion underwrite here — consensus is already there. What consensus is implicitly conceding, and what the buyer must accept with it, is that the SBC drag stays near its reduced ~$322M level and that the insurance-float tailwind does not reverse; the adjusted-consensus line inherits the same normalization caveat as the headline yield. On that conditioning I would put the probability the adjusted yield holds above 8–9% over the next one-to-three years at roughly 65–70% — high because the reported trajectory is rising and the balance sheet is net cash, capped below certainty because a single reserve-release year or a step-up in equity grants would pull the real yield under the bar.
FCF-to-revenue conversion
Conversion is improving, not deteriorating — which is what the levered exception and the buyback flywheel need. On filed revenue (note: the structured feed understates GAAP revenue by roughly $250–490M a year, so filed figures are used here), reported FCF margin moved from negative through FY2023 to 13.2% in FY2024 and 17.7% in FY2025; the adjusted FCF margin reached 11.1% in FY2025 [17].
Reported and adjusted FCF as a share of filed GAAP revenue (FY2025 revenue $6,316.3M) [18]; FCF from company filings.
The improving trend is a genuine mark in the framework's favor: it argues the recent positive FCF is a ramp, not a one-off. It does not settle the yield question, because the level of that FCF still leans on SBC staying contained and on the float contribution the normalization scenarios above test. And the mechanism funding the low SBC cost — shares — shows up as a rising count: shares outstanding grew at a ~6% five-year CAGR even as a $500M FY2025 buyback began, a tension the framework treats as central and which the maturity-and-buyback picture in Self-Help carries in full.
Durability
Lyft clears the disqualifier cleanly — revenue rose every year but the 2020 COVID trough, with no three-year decline. The year-10 gate is harder. Lyft is the smaller side of a low-switching-cost duopoly with no regulatory or capital-intensity moat, its cash-generating record is two years old, and autonomous vehicles — technology Lyft no longer builds — are a well-capitalized, named threat to the network's economics. There is a genuine doubt, so the gate does not hold.
The conviction sources, one by one
The year-10 gate asks whether revenue and adjusted free cash flow will be higher in a decade with very high conviction. That conviction is supposed to come from structure — market power, a regulator that keeps entrants out, capital intensity, essentialness, a long survival record. Graded for Lyft specifically, most of these read weak.
Sources: FY2025 Annual Report — competition and driver-classification risk factors [1]; cash-flow reconciliation [2]; business overview [3].
Market structure. Lyft and Uber are a genuine duopoly in U.S. and Canadian ridesharing — Uber's own 10-K lists Lyft by name among the platforms it competes with for drivers and riders [4]. But a duopoly is not a monopoly, and Lyft is the smaller side. Its own filing is blunt about the structure underneath: "the cost to switch between products is low," riders "have a propensity to shift to the lowest-cost or highest-quality provider and could use more than one platform," and its "market share has fluctuated over time" [5]. Management confirms the share is stabilized, not fortified: the CEO says Lyft's U.S. share "has grown from three years ago when I joined and has held above that point ever since" [6]. A recovered mid-cycle share held by continuous price optimization is stability of execution, not of structure. The Business tab develops the duopoly map; the point for durability is that low switching costs and multi-homing put a ceiling on how much protection that structure confers.
Regulatory entry barriers. These would be a strong conviction source if they existed — the regulator does not let a garage startup take share from a bank or an insurer. For Lyft, the regime runs the other way. Driver-classification rules (California's Proposition 22, minimum-earnings standards in New York, Washington, Massachusetts and Minnesota) raise Lyft's costs and constrain its pricing [7]; they do nothing to keep a new ride-hailing network out. There is no license, spectrum, or charter that a rival would need and cannot get.
Capital intensity as a moat. Also absent. Lyft is a software marketplace: FY2025 purchases of property, equipment and scooter fleet were $52.8 million against $1.17 billion of operating cash flow [8]. Asset-light is good for returns, but it means there is no multi-billion-dollar replacement cost, no irreproducible network of physical assets, standing between Lyft and a well-funded entrant. This is the opposite of the capital-heavy-essential profile that survives the AI world by default.
Essentialness. Partial. Getting from place to place is essential; paying Lyft to do it is discretionary and highly price-sensitive — the filing says demand "is highly sensitive to the price of rides" [9], and a "prolonged recessionary period would likely have a further adverse effect on our revenue" [10]. Its one true recession test, 2020, cut revenue 36%. Riders drop to a personal car, transit, or the cheaper app faster than they drop a health plan or a checking account.
Operating history. Lyft launched its marketplace in 2012 and has been public since 2019 [11]. Thirteen years is enough to have survived a pandemic that halved its volume, but it is short of the 30-to-50-year survival record the framework treats as evidence of durability, and — critically — the surviving years were mostly loss-making. The record proves Lyft can endure a demand shock; it does not yet prove the model throws off durable cash across a full cycle.
The structural threats, hunted
The framework's warning is that execution is not a moat, and that the right question is whether anyone's margin here is an Amazon opportunity. For Lyft the answer has a name: autonomous vehicles.
Autonomous vehicles — a named, funded, quantifiable threat
Lyft sold its own self-driving division (Level 5) in 2021 and states plainly that it "no longer develop[s] our own AV technology," so it must rely on partnerships — and "certain of our partners are also our competitors" [12]. The companies that own the technology are scaling fast and are far better capitalized than Lyft.
Sources: Alphabet Q1 FY2026 call [13] and FY2025 10-K [14]; Tesla FY2024 10-K [15]; Lyft FY2025 10-K [16].
The mechanism is the "your margin is my opportunity" case in its purest form. Lyft keeps a thin slice: adjusted EBITDA was 2.9% of $18.5 billion of gross bookings in FY2025 [17], with the majority of every fare flowing to drivers. A firm that owns both the vehicle and the self-driving software — Waymo, Tesla — can capture the driver's economics and has no structural need to route the ride through Lyft at all. Uber's filing states the risk in the language of price: autonomous vehicles "could substantially reduce the cost of providing ridesharing… which could allow competitors to offer such services at a substantially lower price" than incumbents can [18]. Waymo's 500,000+ weekly rides already run on Waymo's own network, not Lyft's [19] — a demonstration that the disintermediated path is not hypothetical.
The near-term magnitude is modest; the year-10 magnitude is unknowable. Lyft's own framing is that autonomy lowers per-mile cost roughly 20% by 2030, but on a base of only 5-to-10% of rides — a small dent this decade [20]. The year-10 question is not the dent; it is whether the AV technology owners route volume through Lyft's marketplace or around it, and Lyft's CEO concedes the outcome is not knowable: on which AV developers win, "that's the thing that nobody really knows" [21]. A pure durability gate cannot be cleared on a variable its own management calls unknowable.
The other side of the threat
The bull rebuttal is real and has to be stated. First, autonomy may expand the market rather than cannibalize it: Uber's CFO reports early AV adoption in San Francisco and Los Angeles has been "expansionary for ridesharing in the cities in aggregate," not cannibalistic [22], and Lyft says it has kept growing share in San Francisco even as Waymo runs hundreds of thousands of rides there [23]. Second, Lyft's "hybrid network" thesis has a genuine logic: demand swings roughly 20-to-1 between the middle of the night and rush hour, which an AV-only fleet cannot economically staff, so a network combining human drivers with AVs may be the efficient structure — and Lyft is positioning as a fleet operator through its FlexDrive subsidiary (about 50,000 vehicles) with live AV partnerships (Waymo in Nashville, Baidu in London, May Mobility in Atlanta) [24]. If that role proves durable, Lyft participates in autonomy rather than being displaced by it. The weakness is that this is a bet on being a good partner to companies that own the scarce asset and are also its rivals — a position of dependence, not of structural power.
Commoditization, underneath the AV question
Even setting autonomy aside, the marketplace shows commodity characteristics today. Lyft's own "Check Lyft" campaign encourages riders to price-compare the two apps before booking, and management notes an independent study found riders save about $170 a year by doing so [25] — a strategy that only makes sense where the product is close to interchangeable and price is the axis of competition. That is the low-switching-cost admission from the risk factors, restated as marketing.
The disqualifier check — revenue trajectory
The one mechanical disqualifier is three consecutive fiscal years of high-single-digit revenue decline after a long existence. Lyft fails to trigger it. The deterministic feature reads consecutive_decline_years = 0 and three_year_hsd_decline = false.
Source: derived from the reported financial-data feed (revenue from contracts with customers, ASC 606); matches fit_features.revenue_trajectory. The FY2025 10-K reports higher total revenue of $6,316.3M because it adds $420.8M of ASC 842 rental revenue to the $5,895.5M ASC 606 figure [26].
The only down year is 2020, when the pandemic cut revenue 36%. Every other year is up; the last three are +8.0%, +30.4% and +9.9%. On total-revenue basis the same trajectory holds — the 10-K income statement shows revenue rising from $4,403.6M in 2023 to $5,786.0M in 2024 to $6,316.3M in 2025 [27]. Underneath revenue, the volume record is unambiguous growth: rides rose from 598.5M (2022) to 945.5M (2025) and active riders from 20.4M to 29.2M [28], [29].
Sources: FY2025 10-K [30] and FY2023 10-K [31].
On the structural-decline test (X3), the evidence is checked and absent: there is no structural revenue decline — volume and revenue are compounding, not shrinking. Lyft is a growth company, not a shrinking one. The durability doubt here is about the year-10 shape and ownership of that revenue, not its recent direction.
FCF consistency (P2)
The framework wants a stable rolling five-year average of adjusted free cash flow — volatile is fine, unpredictable is not, and an occasional negative year is healthy only when it is an inherent business-model cycle (an insurer's underwriting year), not a break in the model.
The deterministic series is empty: fcf_stability.rolling_5y_avg = [], and adjusted_fcf is not_computable — the feature notes "fewer than five consecutive adjusted-FCF years." That flag is partly a data-feed limitation (the cash-flow feed did not carry a separate capital-expenditure line, so the pipeline could not build FCF), but it points at a real fact: Lyft's positive-cash-flow record is genuinely short. Reconstructed from the filings, company-defined free cash flow was negative every year through 2023 and turned positive only in 2024.
Sources: FY2025 10-K free-cash-flow reconciliation [32]; FY2023 10-K highlights [33]. Free cash flow is company-defined as operating cash flow less purchases of property, equipment and scooter fleet.
Two features matter for P2. First, the negative years were startup cash burn while scaling to profitability — not a recurring underwriting or capital cycle with a 5-to-8-year cadence, so they are not the "healthy" kind of negative episode the framework tolerates. Second, only two positive years exist, so a five-year average of adjusted FCF simply cannot be computed yet. On a single-year basis the adjusted figure is currently healthy — FY2025 free cash flow of $1,115.6M less $322.3M of stock-based compensation [34] less roughly $62M for the trailing-average acquisition spend (Freenow and TBR cost $307.3M in 2025) lands near $730M — but a single strong year is not the multi-year stability P2 requires. The Yield tab computes the yield on that figure. For durability, the honest read is that FCF consistency is unproven, not disproven: the model has generated real cash for two years, and the five-year record that would confirm it does not exist.
The year-10 case, both ways
The strongest case that year-10 revenue and adjusted FCF are higher. Rides and active riders are compounding at double digits, the secular shift away from personal-car ownership is intact, and the total addressable market widens if autonomy makes rides cheaper and opens new use cases. Lyft has just proved it can convert that growth to cash — from a $352M free-cash-flow drain in 2022 to $1.1B generated in 2025 — and, on management's own read, autonomy has so far been additive to ridesharing volume rather than cannibalistic [35]. If the hybrid network is the efficient structure and Lyft holds a durable marketplace-and-fleet-operator role, a decade of double-digit volume growth on a widening TAM plausibly leaves both revenue and adjusted FCF well above today's.
The strongest doubt. Every leg of that case runs through variables Lyft does not control and cannot fortify. It owns no autonomous-vehicle technology and depends on partners who are also its competitors [36]; those partners — Waymo, backed by a $16B Alphabet round, and Tesla — already run their own consumer networks and can price a ride below what a driver-based platform can [37], [38]. Beneath autonomy, Lyft is the No. 2 in a low-switching-cost, multi-homing market with fluctuating share, no regulatory or capital moat, a thin 2.9% take on gross bookings, and a cash-generating record only two years old. Its recent success is a turnaround well executed — and execution is not a moat.
Weighing them, there is a genuine doubt that year-10 adjusted FCF will be higher with very high conviction. Because this gate is binary by construction, that is enough: the durability gate does not hold, and the deciding variable is autonomy — specifically whether the technology owners route volume through Lyft's network or around it, an outcome Lyft's own management calls unknowable [39]. What would change the read is evidence that the hybrid network becomes structurally necessary — AV supply routed through Lyft at scale on durable economics — rather than a courtesy its partners can withdraw.
Self-Help
Lyft can easily outlast its own dislocation: unrestricted liquidity of $1.84 billion sits against $1.05 billion of near-zero-coupon convertible debt with no maturity before 2029, so capital allocation is never forced toward debt paydown. The repurchase engine is the problem. On the framework's own disqualifier — a rising multi-year share count — Lyft's feature reads rising (227.5 million shares in 2019 to 417.7 million in 2025). A two-year-old buyback, launched to offset stock comp, only just began to shrink the count.
The balance sheet against the problem's duration
Lyft ended FY2025 with $1,132.0 million of cash and equivalents plus $705.2 million of short-term investments — $1,837.2 million of unrestricted liquidity — against $1,053.0 million of total debt [1]. That is roughly $784 million of net cash on a full-liquidity basis; the deterministic feature, counting cash only against debt, puts net debt at −$79.0 million and classes the balance sheet fortress either way.
Unrestricted Liquidity ($M)
Total Debt ($M)
Net Cash, incl. ST investments ($M)
Source: FY2025 Annual Report (Form 10-K), Consolidated Balance Sheets — cash $1,132.0M, short-term investments $705.2M, debt $1,053.0M [2]; balance-sheet class from fit_features.balance_sheet_class.
The debt is almost entirely convertible notes carrying token coupons: $452.4 million of 0.625% notes due March 2029 and $488.5 million of 0% notes due September 2030, plus a $112.0 million master vehicle loan amortizing through 2028 [3]. Total interest expense in FY2025 was $20.8 million [4]. The year-by-year maturity ladder shows nothing meaningful due until 2029:
Source: FY2025 Annual Report (Form 10-K), Maturities of long-term debt outstanding — p.180 [5].
The covenants that bind are liquidity-maintenance terms on the marketplace, not leverage tests that would trap cash — management lists maintaining "ample liquidity for operations and to comply with our existing covenants" as its first capital-allocation priority [6]. Refinancing risk is minimal: the two converts are long-dated and near-costless, and in FY2025 Lyft issued the $500 million 2030 notes while simultaneously repaying the $390.7 million 2025 notes with cash [7]. Nothing about the balance sheet forces capital toward debt reduction at the moment repurchases would matter most. On the ability half of the pillar, Lyft comfortably clears.
The repurchase record — executed, not just authorized
Buybacks are recent. Cash actually spent on repurchases was zero in FY2022 and FY2023, $50.0 million in FY2024, and $499.99 million in FY2025 [8]. The program was authorized at $500 million in February 2025, raised to $750 million in May 2025 [9], and topped up with a fresh $1.0 billion authorization in February 2026 [10].
The problem is what the count did while the company was diluting through it. The share-count feature — diluted weighted-average shares — rose every year from 227.5 million in 2019 to 417.7 million in 2025, an 84% increase and a 5.99% five-year CAGR, and it registers rising: true.
Source: fit_features.share_count_trend (derived from company filings, FY2019–FY2025 10-Ks).
On the framework's own rule — a company whose share count keeps rising through stock-based compensation fails outright — Lyft's share-count feature reads rising across the full six-year record. That is the P4b disqualifier, stated as arithmetic.
The counter-fact is real and worth stating in the same breath: FY2025 is an inflection. Because $500 million of repurchases plus a $151.3 million net-share-settlement tax outflow finally outran issuance, point-in-time Class A shares issued and outstanding actually fell, from 409.5 million at end-2024 to 400.9 million at end-2025 [11]. The chart below shows why the trend feature and the point-in-time count disagree: buyback cash first crossed above stock-comp only in FY2025.
Source: FY2025 Annual Report (Form 10-K), Consolidated Statements of Cash Flows — p.127 [12].
Prices paid are the other caution. The FY2025 repurchases and the record $300 million bought in Q1 2026 were transacted well above today's quote: Lyft paid an average of $20.54, $21.39 and $21.46 per share across October, November and December 2025 [13], against a $14.20 close on July 24, 2026. Capital deployed at $20–21 is currently carried at roughly a third less. The buyback flywheel spins hardest at low prices; most of Lyft's spend so far went in at higher ones.
Management's buyback intent, from the record
The stated purpose of the program is the framework's exact concern. When the board authorized the first $500 million in February 2025, management described it plainly as "a $500 million share buyback program to offset dilution from stock-based compensation" [14]. The capital-allocation frame put "shareholder returns, starting with dilution management" third, behind liquidity and growth investment, and paired the buyback with a switch to net-share settlement expected to "reduce dilution by approximately 2 percentage points" [15]. Asked directly in mid-2024 whether the balance sheet might become "another tool for driving equity value," CFO Erin Brewer offered "nothing specific to announce," adding that higher future free cash flow "gives us more optionality" [16].
The language then hardened toward genuine reduction. On the Q1 2025 call management raised the authorization "to $750 million while maintaining the ability to invest" [17]; by Q2 2025 the opener claimed Lyft "reduced our share count by repurchasing $200 million worth of stock" [18]; and Q1 2026 reported "our largest quarterly share repurchase ever, totaling $300 million" [19]. The intent is now to shrink the count, and the cash is going out the door to do it. What the record does not yet show is a demonstrated multi-year reduction — the program is two years old and started from a rising base.
Insider behavior corroborates the improved intent. CEO David Risher has made six open-market purchases since mid-2024 — roughly 90,600 shares for about $1.15 million — buying at prices from $9.67 (August 2024) to $19.80 (December 2025), including 7,490 shares at $13.38 in February 2026 near the trough [20]. A chief executive adding personal cash at the lows, repeatedly, is the opposite of a promoter distributing stock into a rally.
The levered exception
It does not apply. Lyft is a net-cash, fortress balance sheet, not the levered profile (Charter-style, ~25–40% adjusted yield with a decade of halving the count) that the framework tolerates debt for. Because the exception is only reached when leverage is high and the yield extreme, none of its three legs is even in play here; the pillar is decided on the ordinary rising-count rule above, not the levered carve-out.
The absurdity check
The float-retirement feature is not_computable: the structured cash-flow feed lacked a capex line, so the deterministic pipeline could not build adjusted FCF. The 10-K reports the pieces, so the arithmetic can be shown transparently rather than skipped — reported free cash flow (operating cash flow $1,168.4 million less $52.8 million of capex) was $1,115.6 million in FY2025 [21]. Against a $5,930.8 million market cap, that retires the entire float in about 5.3 years on reported FCF, or roughly 8 years after subtracting $322.3 million of stock comp and a ~$61 million five-year average of acquisition spend to reach the framework's adjusted basis.
Eight years is not the ~3-year absurdity that signals an impossible price. And it flatters reality in one direction that matters here: FY2025 operating cash flow carried roughly $0.8 billion of working-capital tailwind from rising insurance reserves and accruals [22] — timing benefits that reverse as claims are paid. On a mid-cycle cash figure the float retires far more slowly. The normalization is the province of the Yield tab; the point for self-help is only that Lyft is not so cheap on real cash that buybacks alone re-rate it.
Dividend safety
Not applicable — Lyft pays no dividend, so no part of the return case rests on a payout.
Management credibility
The promotional-CEO exclusion checks three things together — big claims, repeated misses, and low ownership. Lyft has the first and third but not the second, so the pattern does not trigger. On delivery, the record under Risher (CEO since April 2023) and Brewer is clean across the tested window: four material commitments from 2024–2025 calls all landed.
Source: Lyft quarterly earnings calls Q2 2024–Q4 2025; outcomes corroborated by later calls in the corpus (Calls curation).
Two caveats keep this from being unqualified. First, insider economic ownership is thin: CEO Risher held 1,069,292 shares (under 1%) and all ten officers and directors together held 3,562,142 shares — well under 1% of the 388.9 million-share base — as of March 2026 [23]. The mitigant is structural rather than economic: the founders' Class B super-voting stock was retired in 2025, so control now tracks one-share-one-vote rather than an insider block. Second, the promotion that does exist is concentrated in autonomous vehicles — framed as "extremely bullish" and "transformational" while management has declined to quantify AV unit economics — and the FY2025 headline of $2.84 billion net income and $6.92 basic EPS is a one-time deferred-tax valuation-allowance release, not cash earnings, a fact the filing discloses clearly [24]. A reader should discount the AV rhetoric and the GAAP-profit headline, but neither rises to the eHealth-style promotional pattern the framework excludes.
The Durability tab carries the year-10 and FCF-consistency evidence; the cash the buyback runs on is normalized in Yield; what shook the price loose sits in Dislocation.
Clock
At $14.20, Lyft's re-rating does not require a fundamental inflection — the cash already recovered (a record $1.12 billion of trailing free cash flow, gross bookings up 19%) while the share price fell 48% from its November 2025 peak [1]. What fell was the multiple, on autonomous-vehicle fear. The catalysts are dated: the Q2 print on August 6, 2026, an accelerating buyback, and the Waymo–Nashville hybrid fleet going live this summer. Lyft's own turnaround-era history shows four ~50% drawdowns round-tripping in 10–18 months. Long-dated listed options exist; implied volatility is elevated near 76%.
What closes the gap
The distinctive feature of this dislocation is that the operating numbers never broke. The stock peaked at $24.57 on November 12, 2025 and fell to $12.65 by March 30, 2026 — a 48.5% decline — through a string of mostly-beating prints: Q3 FY2025 (reported November 5, 2025) beat, Q4 FY2025 (February 10, 2026) delivered record profitability, and Q1 FY2026 (May 7, 2026) grew gross bookings 19% on a small EPS miss. Over that window Lyft generated a record $1.12 billion in trailing free cash flow and executed its largest-ever quarterly buyback, $300 million in Q1 alone [2]. The gap to close is therefore a multiple gap, not an earnings gap. That shapes the mechanisms below.
The dated catalysts
Sources: Q1 FY2026 earnings-call transcript [3] and Waymo–Nashville question-and-answer exchange [4]; 2027 targets from the Q4 FY2025 call [5]; next-earnings date from consensus calendar.
The buyback shrinking the denominator. Repurchases scaled from $50 million in FY2024 to $500 million in FY2025, then to $300 million in Q1 FY2026 alone — the largest quarter Lyft has run [6]. Annualized, a $1.2 billion pace against a $5.9 billion market capitalization is roughly a fifth of the float. The honest counter-fact: this has not yet net-shrunk the share count. Diluted shares still rose from 413.7 million (FY2024) to 417.7 million (FY2025) as stock-based compensation offset the FY2025 repurchases — so far the buyback has funded a standstill, not a reduction. The mechanism becomes a re-rating force only when the Q1-pace repurchase out-runs SBC and the count inflects down; that inflection is the thing to watch in Self-Help.
Guidance resetting against a low bar. Management guided Q2 FY2026 gross bookings to accelerate to roughly 20% and adjusted EBITDA to expand by more than 30% year-over-year [7]. Consensus, meanwhile, has drifted the FY2026 EPS estimate down over the past 90 days (from $0.626 to $0.558), setting the bar that the August 6 print is measured against.
A feared event that has not happened. The multiple compressed on the fear that autonomous vehicles displace the rideshare network. Lyft's response is a hybrid marketplace — it partners with AV developers and operates their fleets rather than competing on the technology. The company reaffirmed that AVs "are not going to be material in 2026" financially, framing them as TAM expansion rather than near-term displacement [8]. The concrete, dated proof point: the Waymo partnership in Nashville, where Lyft takes over fleet operations later this summer and opens an 80,000-square-foot depot so riders can order a Waymo inside the Lyft app [9]. Whether the AV transition is a market-expander or a margin-eroder is the temporary-versus-permanent question decided in Damage Math; the company's own filing concedes the market is "new and evolving" and hard to predict [10]. For the clock, the point is narrower: the feared displacement is not scheduled to arrive inside the re-rating window.
Base rates from Lyft's own history
Two regimes sit in the price record, and they carry opposite lessons. From the first trading close of $78.29 (March 29, 2019) to the all-time low of $7.99 (May 24, 2023), Lyft fell about 90% and has never revisited those highs — a structural de-rating, not a swing. Since the turnaround under CEO David Risher began in 2023, the pattern changed: violent, repeated ~50% drawdowns that have each round-tripped, with the stock making higher local highs ($16 → $20 → $24.57).
Source: run daily price history, month-end closes (data/prices/daily.json); IPO-day close March 29, 2019 through July 24, 2026.
The turnaround-era episodes are strikingly uniform. Four drawdowns of 46–55%, each reaching its trough in about 3.5–5 months, and — for the three that have completed — each recovering to its prior peak within 10–18 months.
Source: derived from run daily price history (data/prices/daily.json); episodes defined by a 30% peak-to-trough reversal filter; the current-episode depth matches the deterministic capitulation gauge (fit_features.capitulation_gauge, −48.5%).
Source: derived from run daily price history (data/prices/daily.json).
The arithmetic a skeptic can recompute: depth is (trough − peak) / peak; the round-trip is calendar days from peak to trough plus days from trough to the first close at or above the prior peak, converted at 30.4 days per month. The FY23 round-trip ran 370 days (12.2 months), FY24 ran 543 days (17.9 months), and the FY25 episode ran 303 days (10.0 months). The current episode reached its trough in 138 days — squarely inside the historical 104–148 range — and has recovered from $12.65 to $14.20, still 42% below the $24.57 peak.
Two limitations bound this base rate honestly. First, the sample is small and one-regime: three completed round-trips over roughly three years, all inside the same turnaround. It is a base rate for the current Lyft, not for the 2019–2023 company that fell 90% and never came back. Second, the current episode began from the highest peak of the four, so a full round-trip to $24.57 is a larger demand than the recoveries to $16–$20 that preceded it.
The 18-month test
Re-recognition within roughly 18–24 months is a reasonable expectation on this evidence, with one condition. The mechanism does not require years of cycle repair because there is no cyclical damage to repair — free cash flow is already at a record and bookings are still compounding at ~19–20%; the recovery is a multiple normalization, not an earnings rebuild. The base rate agrees: every completed turnaround-era round-trip finished inside 18 months, and the current drawdown is tracking the same peak-to-trough cadence. The condition is that the autonomous-vehicle fear recedes rather than proving structural. This read fails to fire if that fear is correct — if the AV transition compresses Lyft's rides or take-rate durably (the question Damage Math adjudicates), or if gross-bookings growth decelerates below the guided ~20% and the buyback pace reverts so the share count keeps rising. Those are the name-specific falsifiers the Fit tab carries with thresholds.
What consensus expects, and when
The sell side is neither piled into the story nor capitulated out of it. Of 43 analysts, 28 sit at hold — a 65% "show-me" majority — with 14 at buy or better and just one sell-rated view. The mean price target of $19.00 sits about 34% above the $14.20 spot, and even the lowest target ($14.00) is at the current price, so no house is modeling further downside from here.
Mean price target
Upside to mean (vs $14.20)
Analysts covering
At hold
Source: consensus analyst targets and recommendation distribution, as of July 24, 2026 (data/estimates/analyst_estimates.json).
Source: consensus recommendation distribution, current month (data/estimates/analyst_estimates.json).
On the printed-numbers path, consensus expects the recovery to show up in cash first. Forward free-cash-flow estimates rise from about $1.09 billion (FY2025) to $1.13 billion (FY2026) and $1.29 billion (FY2027) — yields of roughly 18%, 19%, and 22% on the current market capitalization. Because FY2025 free cash flow already printed a record, the "recovery quarter" the market usually waits for is not a rebound from a trough but a confirmation that the double-digit bookings growth and margin expansion continue.
Source: consensus estimates (fit_features.consensus_forward_yield, derived from data/sp/estimates.json); FY2027 free-cash-flow yield computes to 21.7% on the $5.93B market cap.
The candidate quarter is Q2 FY2026, reported August 6, 2026. It is the first print to test the guided acceleration to roughly 20% bookings growth and more than 30% adjusted EBITDA growth; consensus pins Q2 EPS near $0.145 on revenue of about $1.81 billion (up 13.7% year-over-year). Q3 FY2026 (roughly November 2026) is the confirmation. Consensus expects the larger EPS step later — FY2027 at $0.930 versus FY2026 at $0.558 — so the sell-side's own timing for the recovery to become unmistakable in earnings sits in FY2027, consistent with the 18-month window.
Instrument facts
These are stated as facts, not as guidance. Listed options on LYFT extend well beyond twelve months: expirations are available out to December 17, 2027 and January 21, 2028 — roughly 17 and 30 months from today — so qualifying long-dated contracts exist. Liquidity is deep: total open interest runs to roughly 656,000 contracts (about 420,000 calls and 236,000 puts), against a 52-week average call open interest near 497,000 (Market Chameleon, open-interest trends). Implied volatility is elevated: the 30-day mean was 76.0% and the 120-day mean 61.6%, both as of July 23, 2026 (AlphaQuery option statistics) — the near-dated figure sits above the 60–70 elevated band and the longer-dated figure within it.
Because qualifying long-dated options do exist, the framework's watchlist-only-by-instrument consequence — which applies when no such contracts are listed — is not triggered here. The elevated implied-volatility reading is recorded as a dated fact; it is not extrapolated, and no strike, expiry, or structure is named.