Lyft, Inc.'s management explains the business in its own materials. The slides below do the most of that work, pulled from the documents preserved in Sources. Each source link opens the complete presentation at that slide in a new tab.
The latest earnings deck and the fullest current snapshot: what the business does, how it grows, and where the numbers stand. · Open the full document →
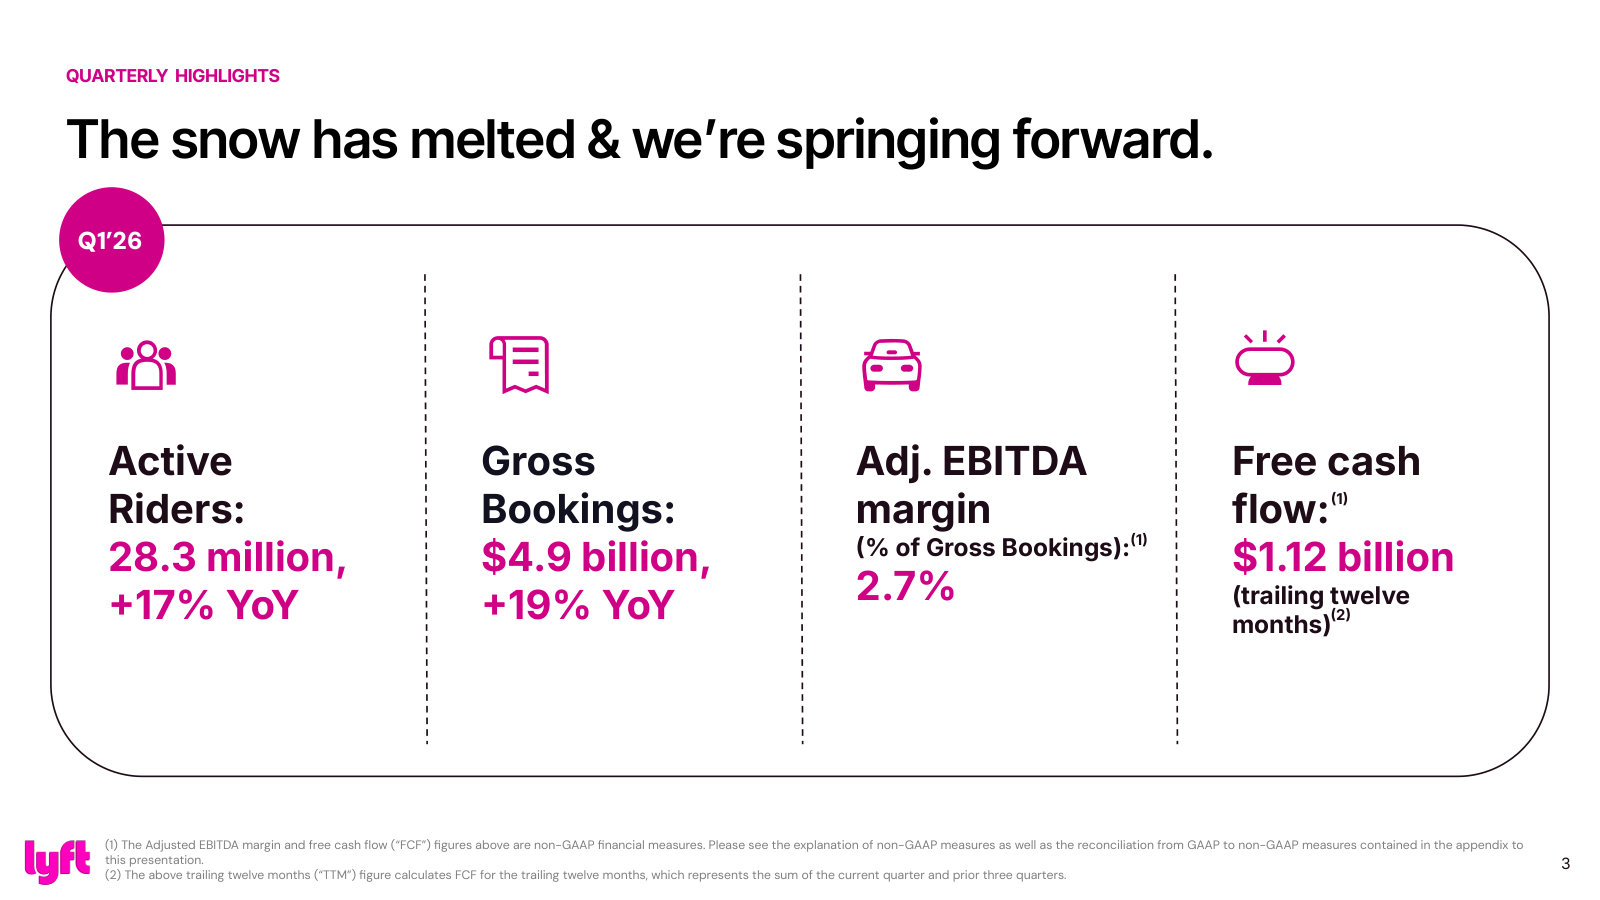
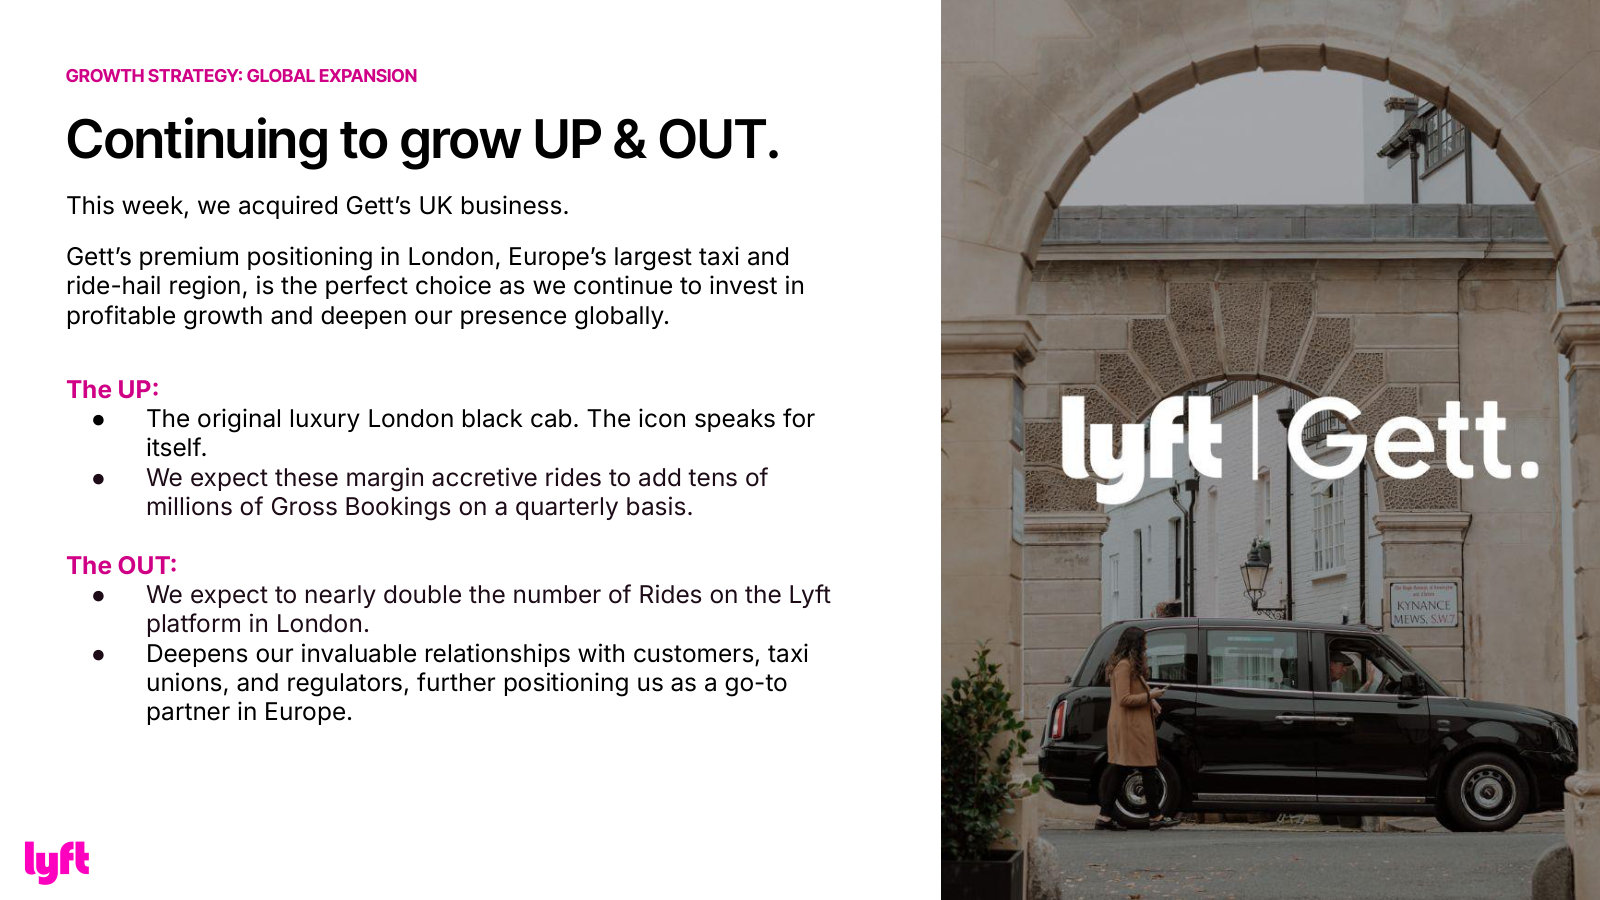
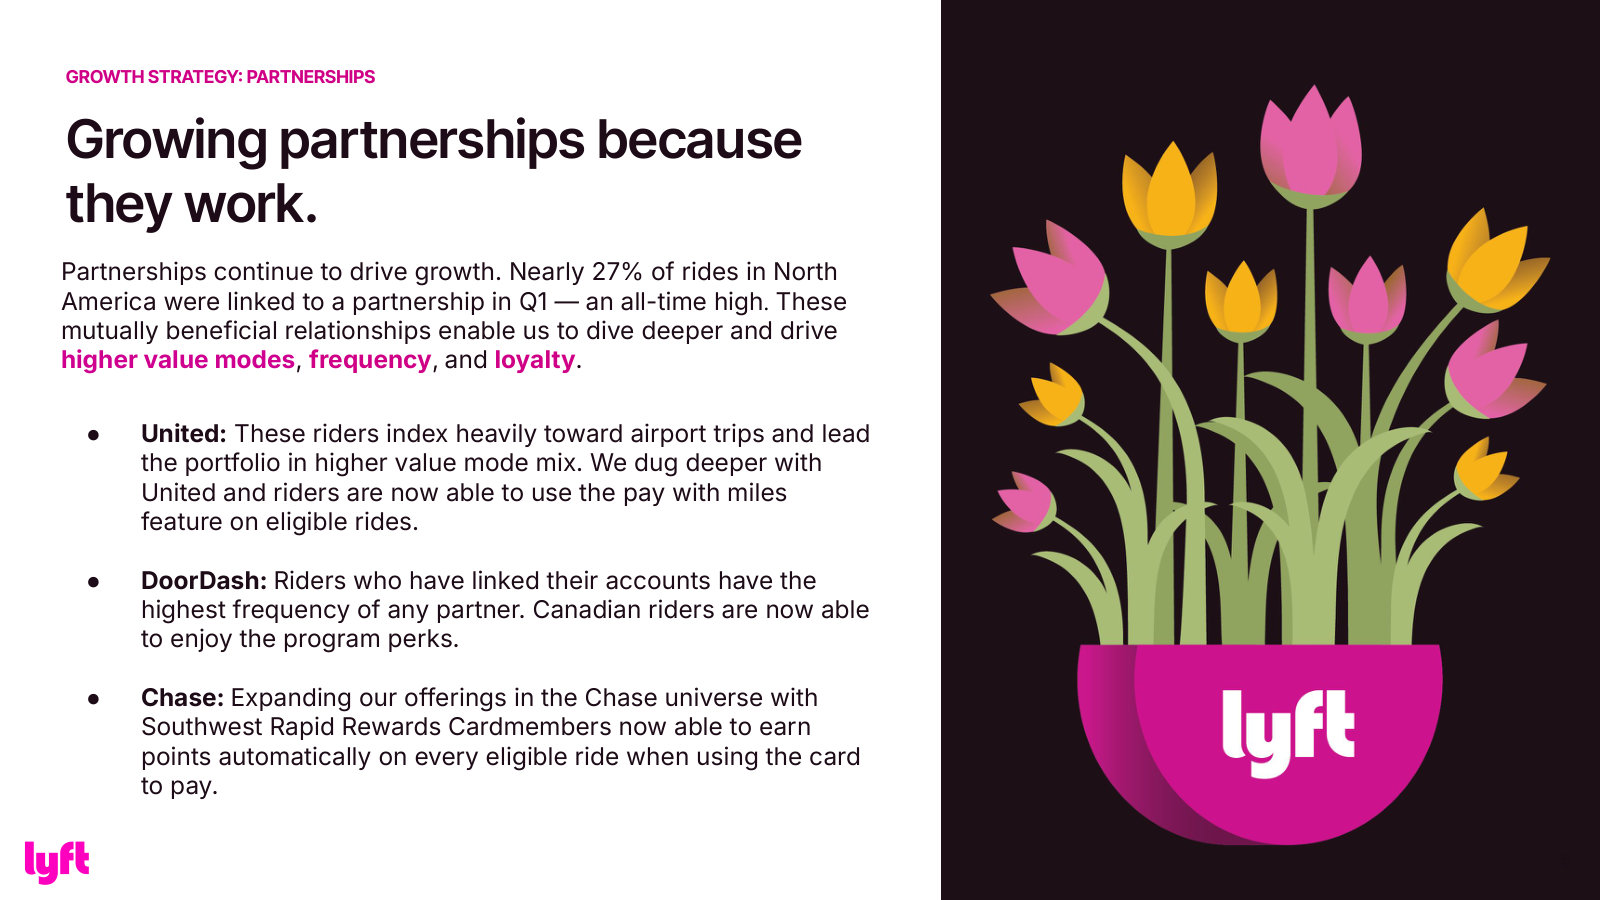
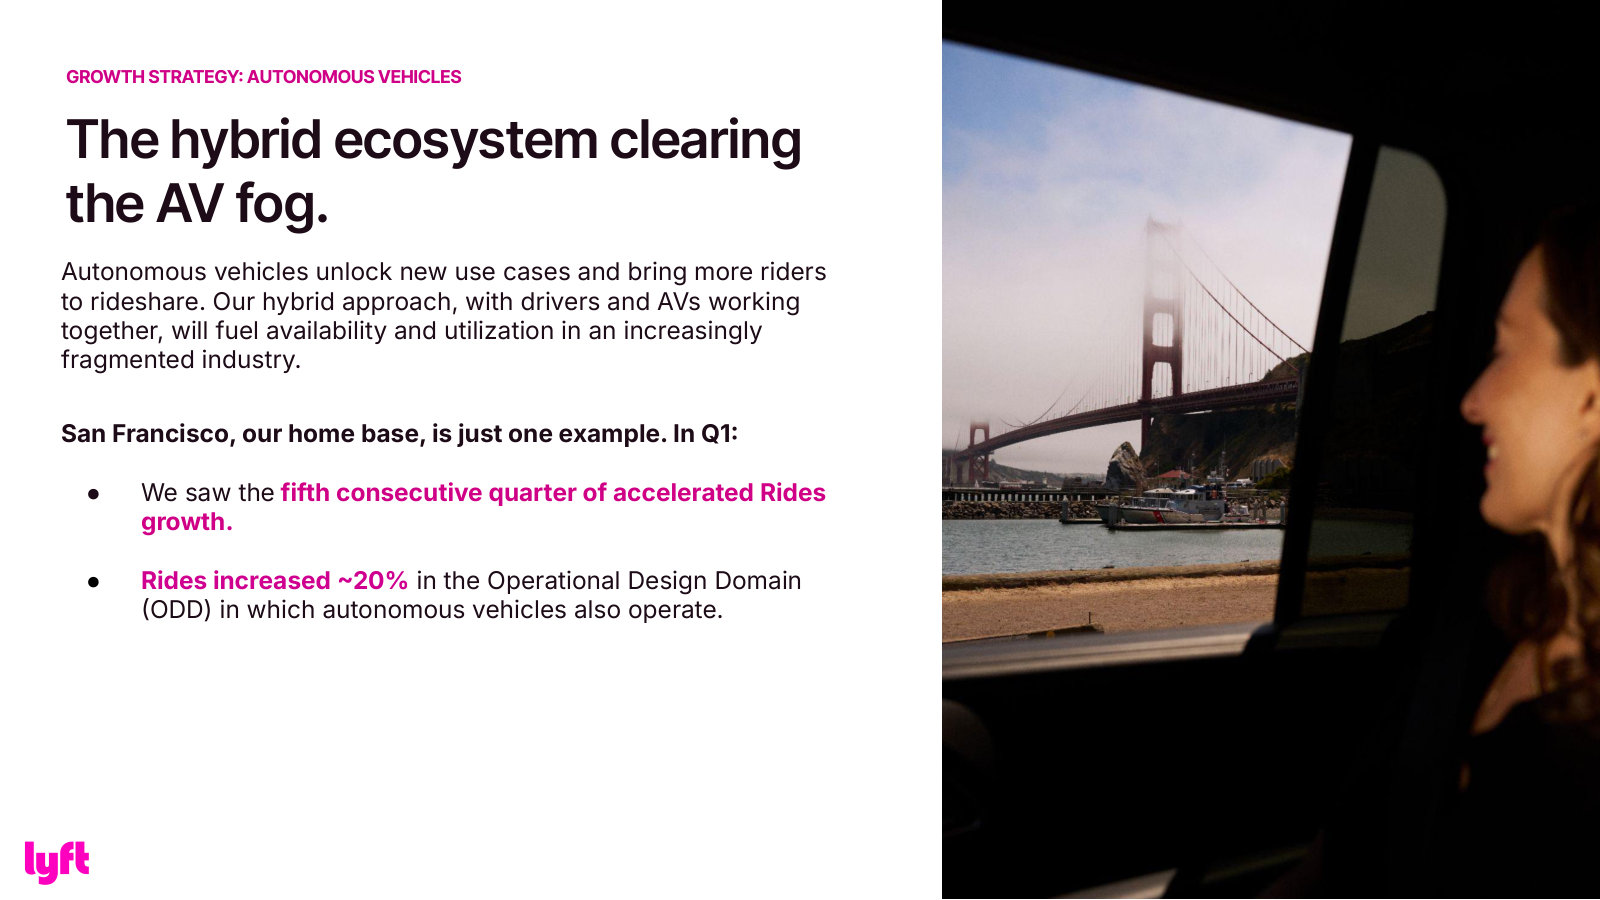
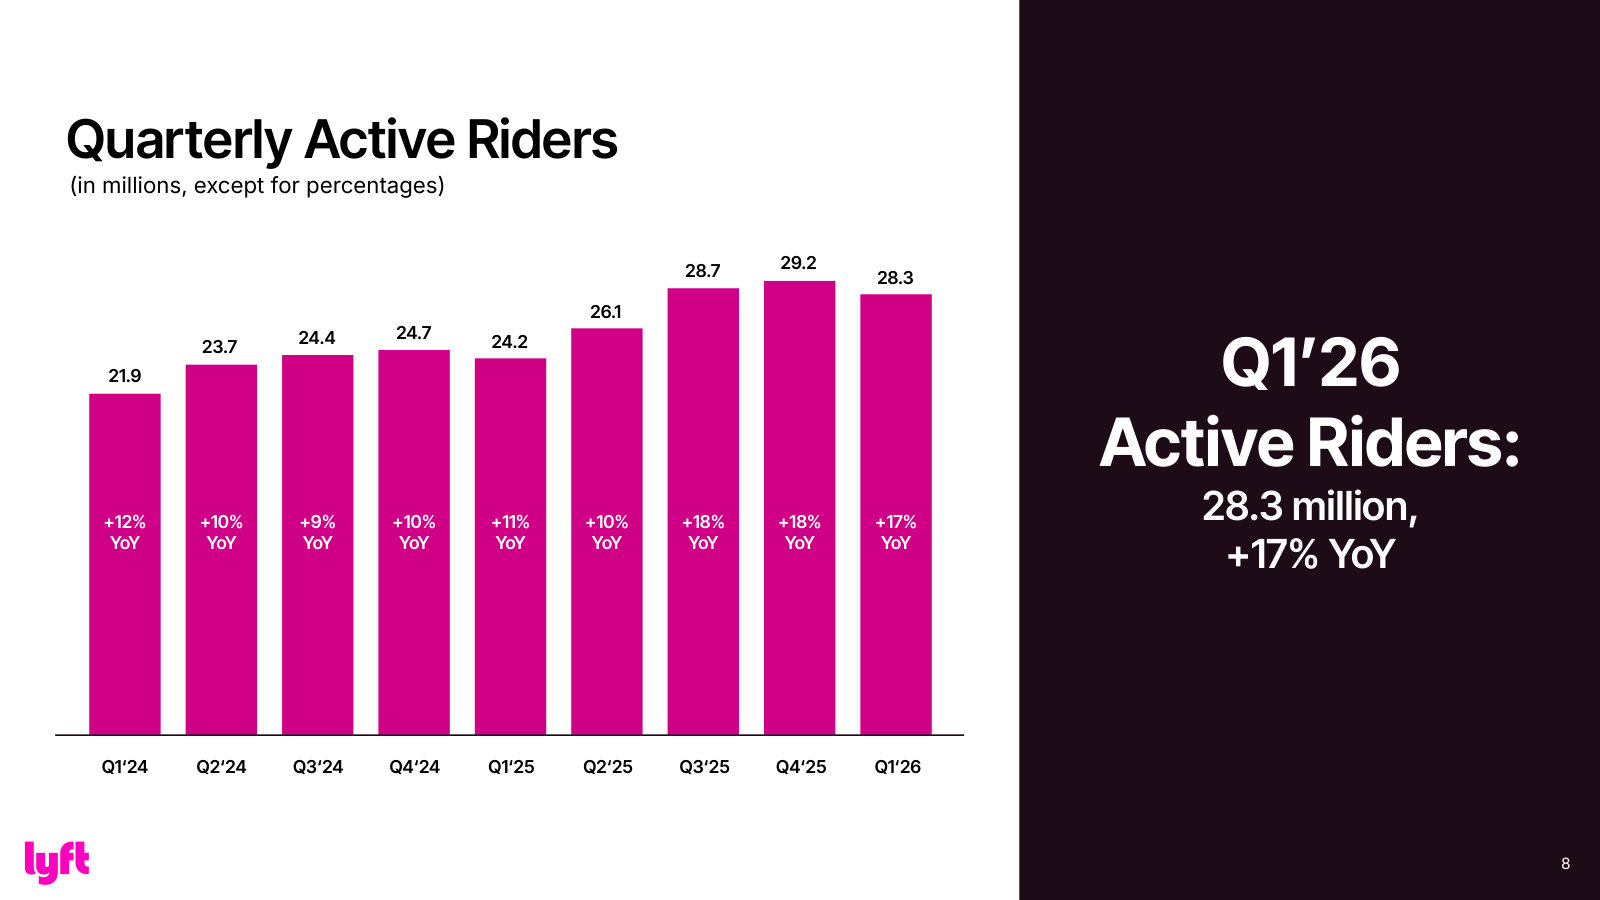
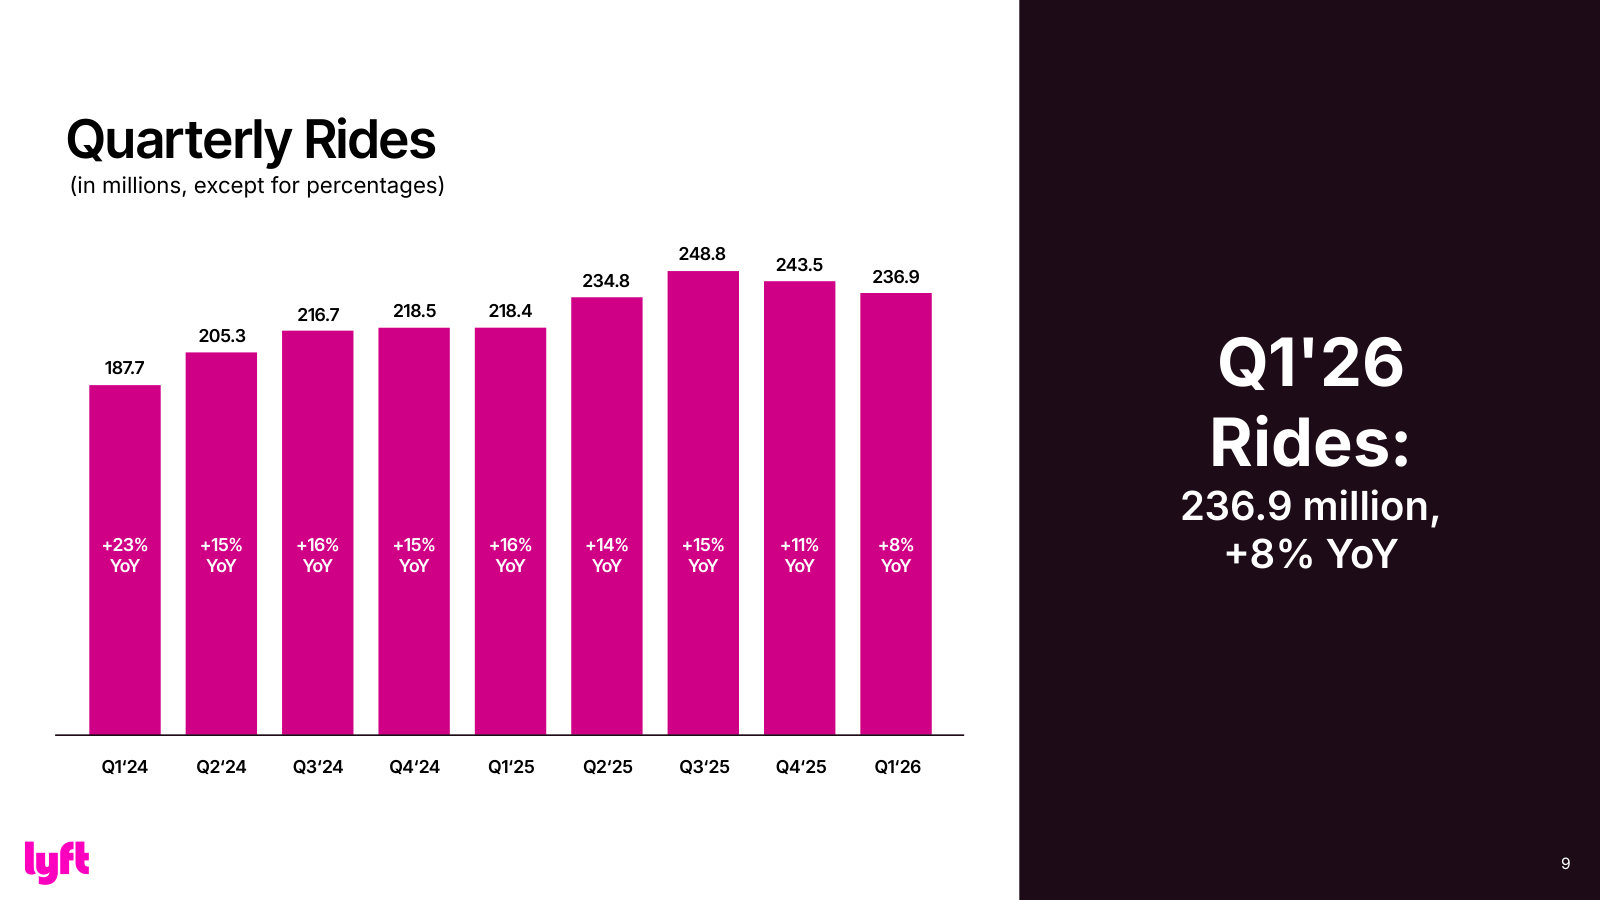
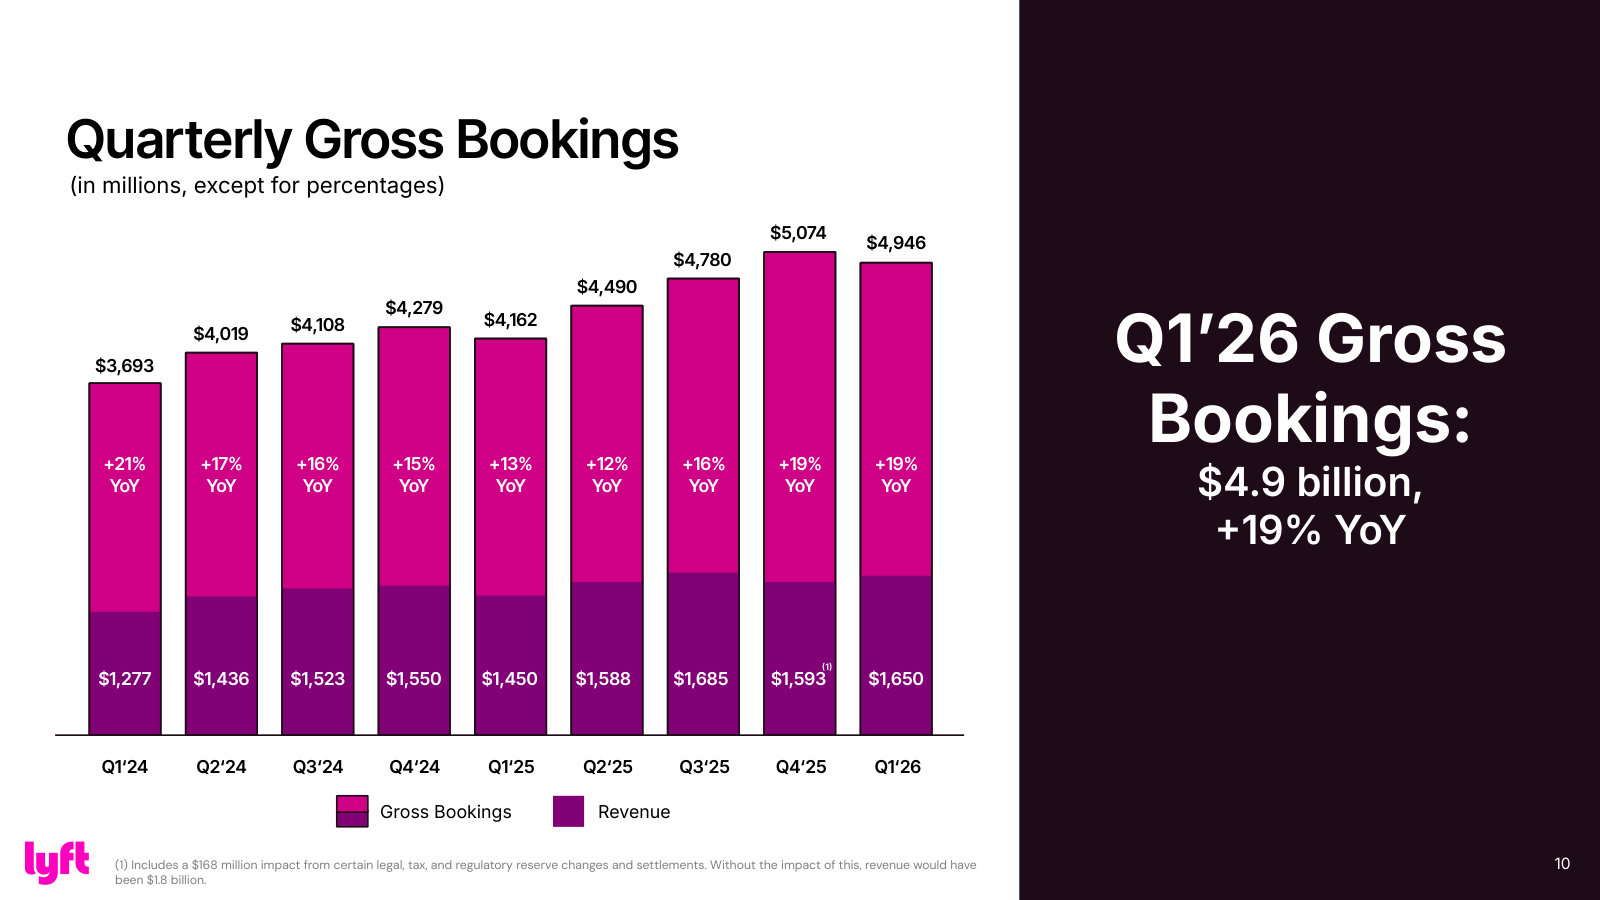
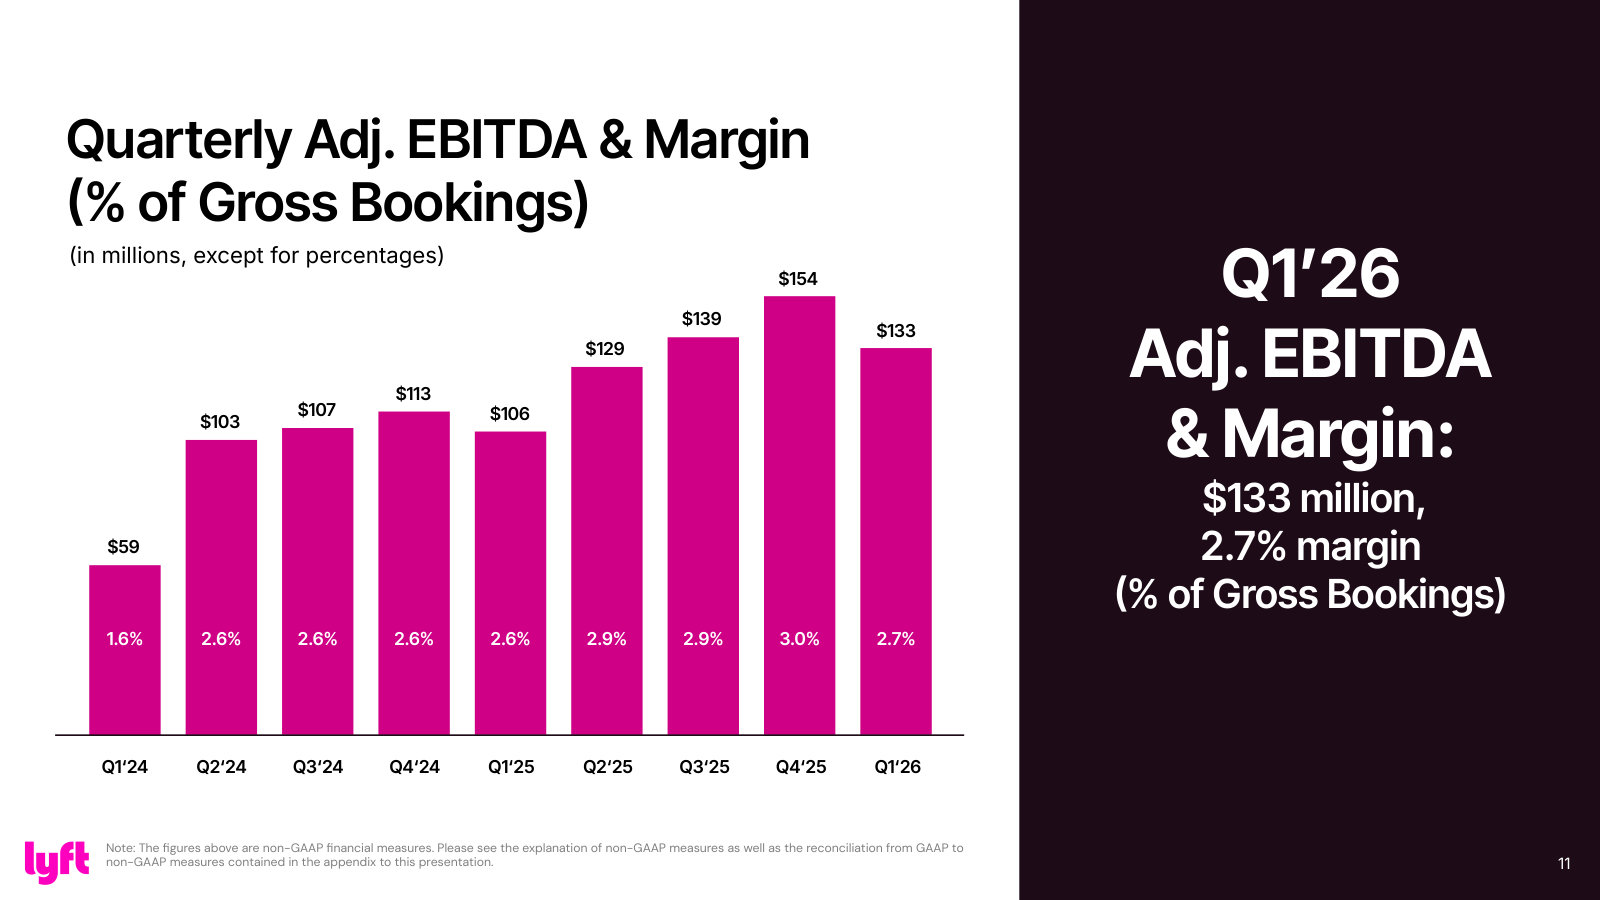
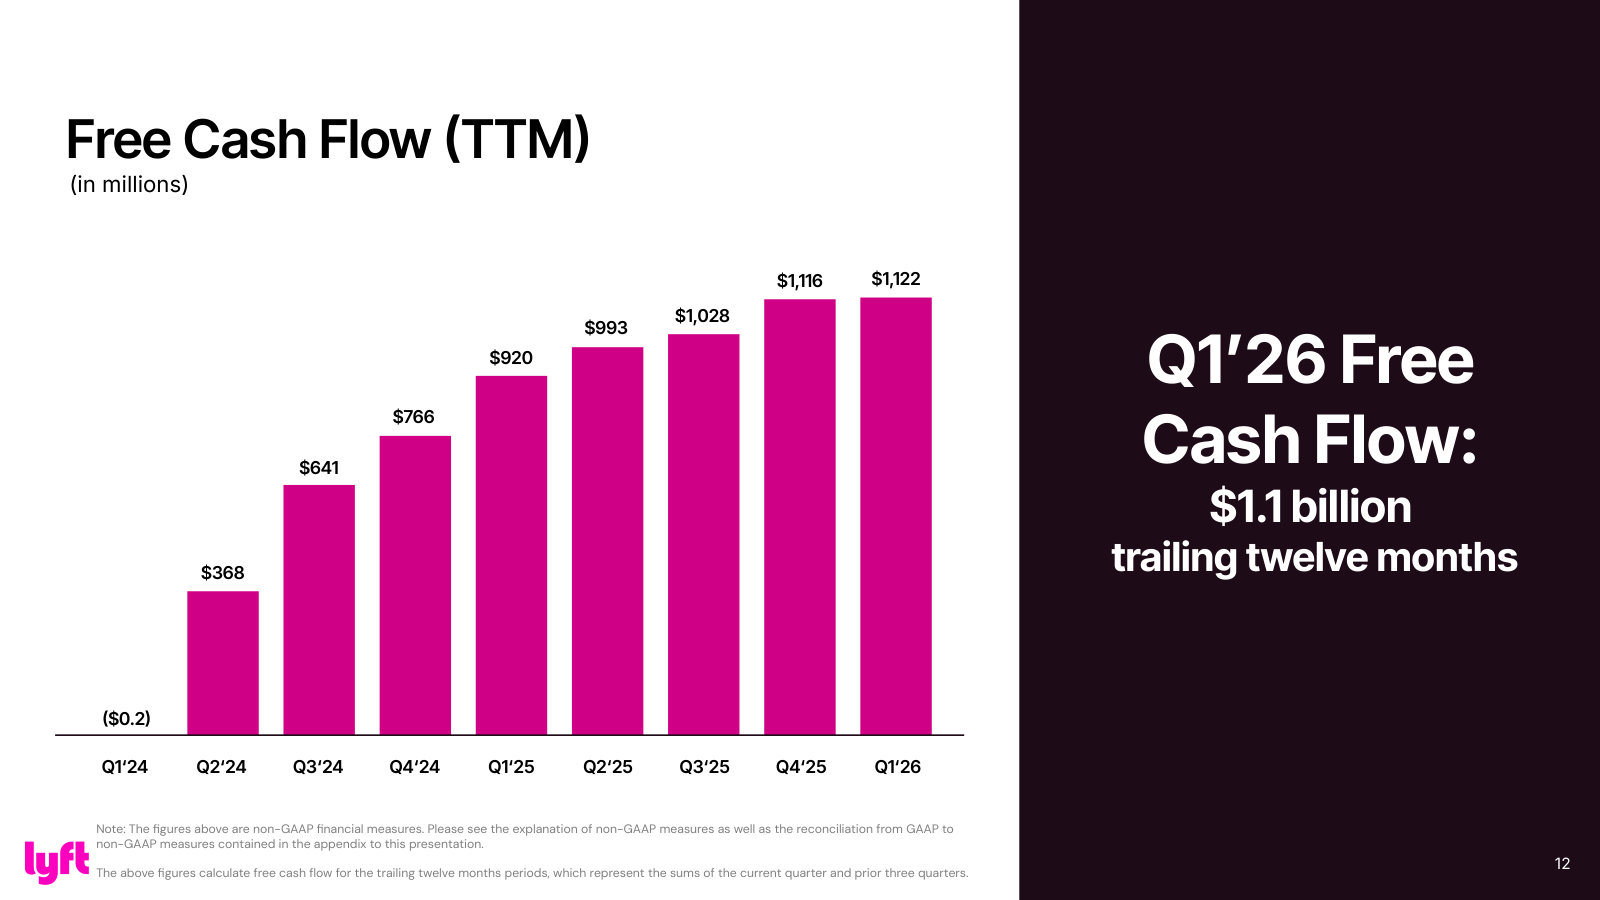
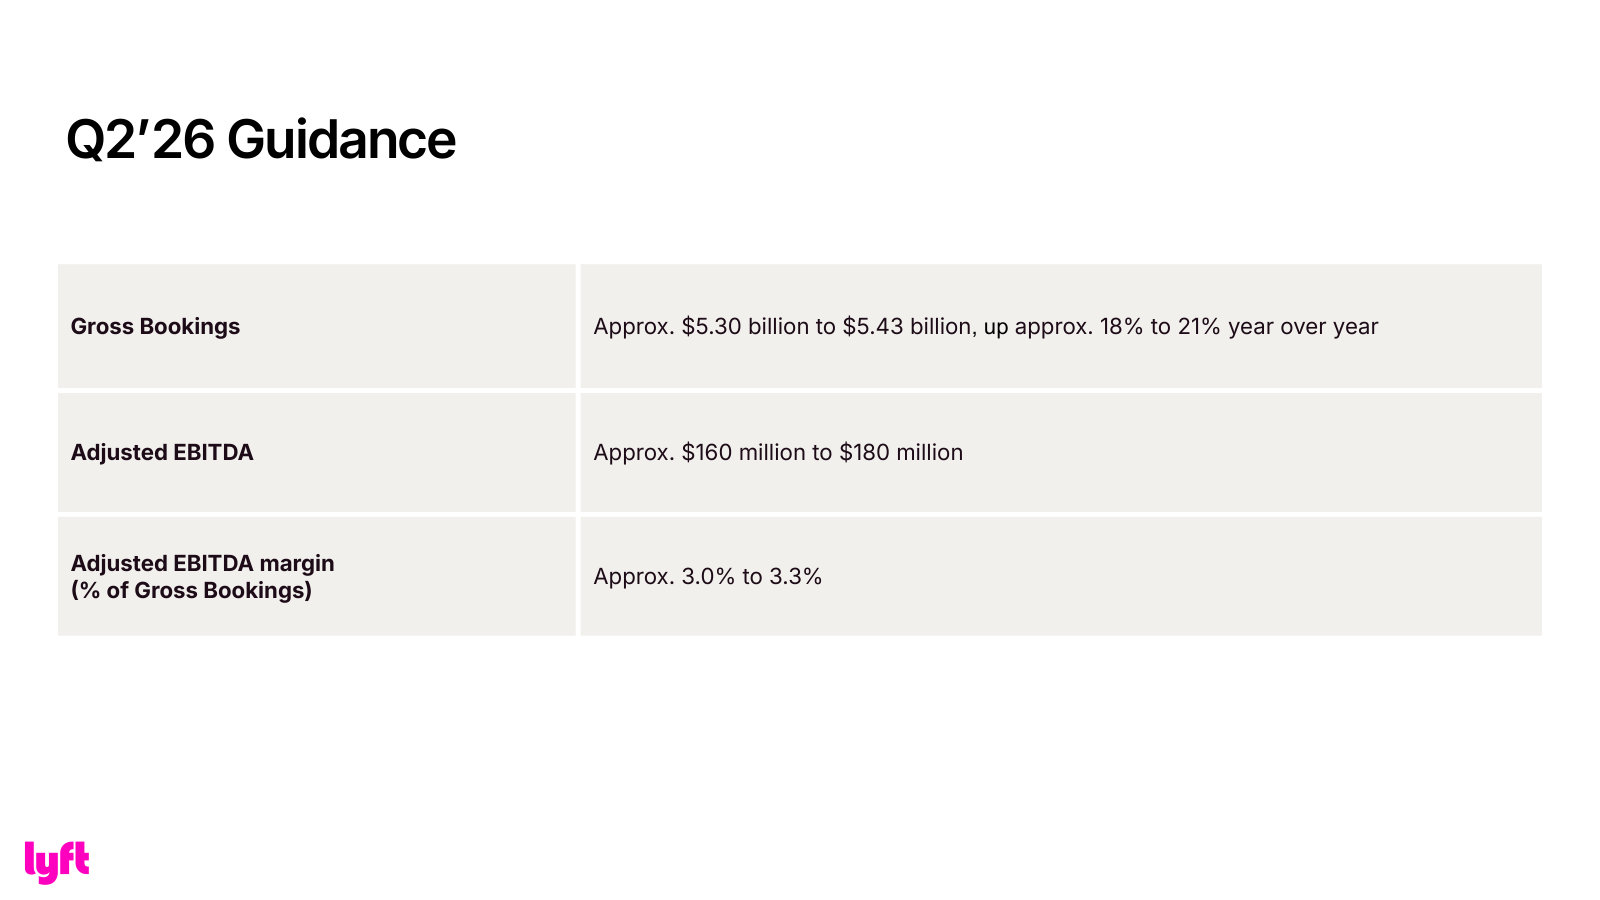
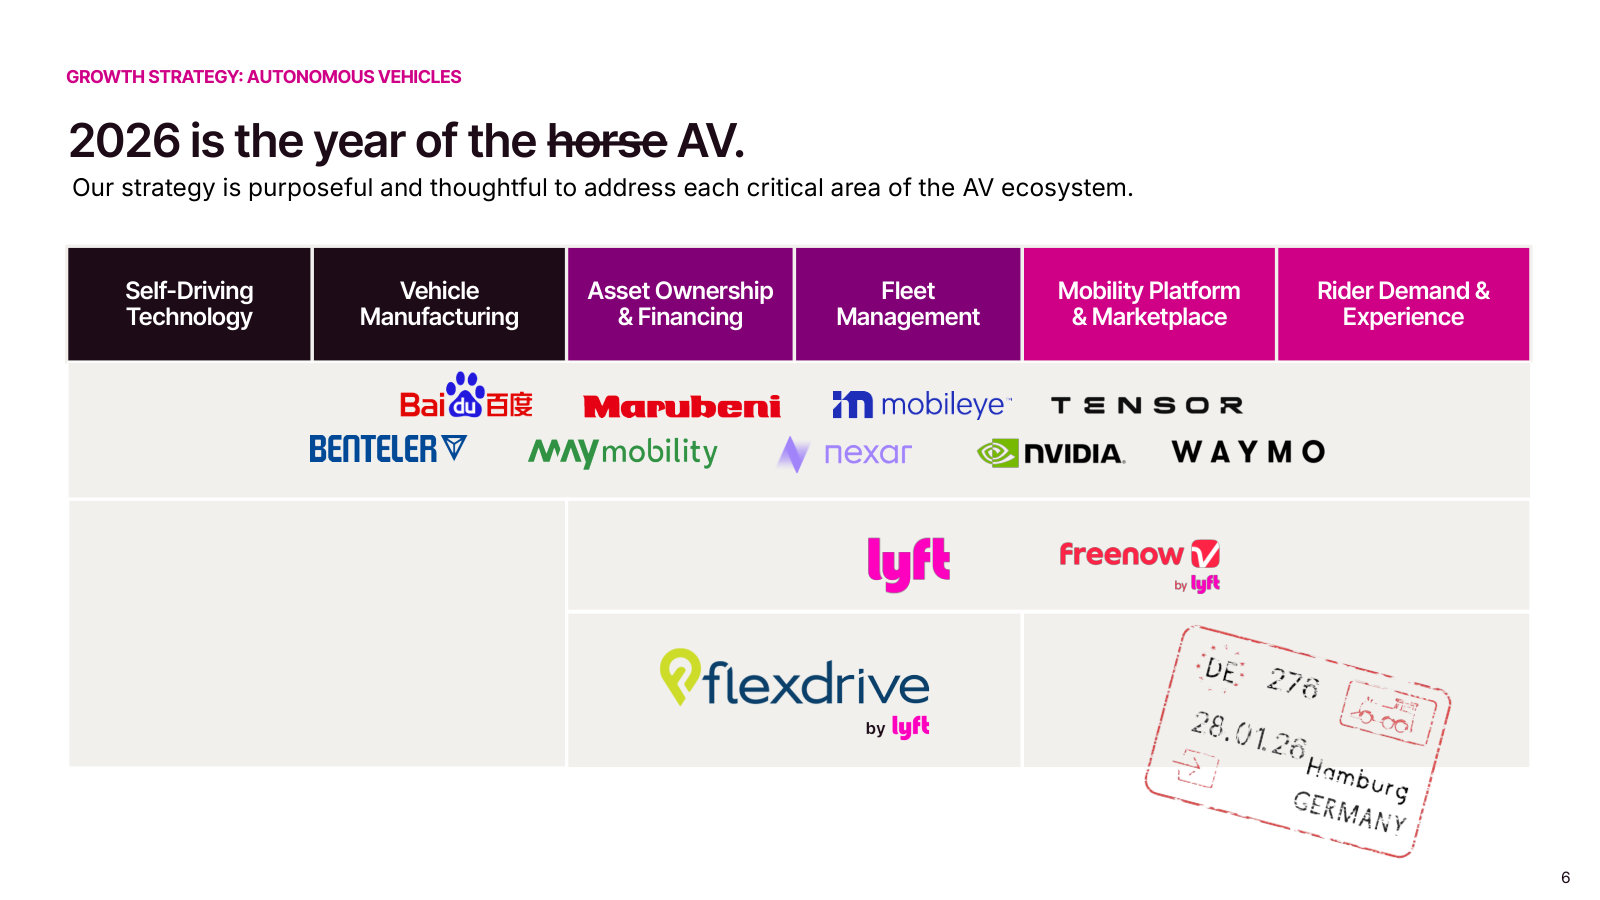
p. 3 — One-glance quarter: 28.3M active riders, $4.9B gross bookings, 2.7% adj. EBITDA margin, $1.1B TTM free cash flow — the four numbers that define the business. · Open the full presentation →p. 4 — Growth strategy, geography: the Gett UK acquisition and the case for expanding beyond North America into London/Europe. · Open the full presentation →p. 5 — Growth strategy, partnerships: how United, DoorDash and Chase tie-ins drive rider frequency and loyalty — ~27% of NA rides now partnership-linked. · Open the full presentation →p. 6 — Growth strategy, autonomous vehicles: management's 'hybrid' framing of how drivers and AVs coexist rather than compete. · Open the full presentation →p. 8 — Active riders by quarter since Q1'24 — the top-of-funnel demand trend, growing double digits. · Open the full presentation →p. 9 — Rides per quarter — the core volume metric and its year-over-year growth. · Open the full presentation →p. 10 — Gross bookings split into the revenue Lyft keeps — the clearest read on the marketplace take-rate and business model. · Open the full presentation →p. 11 — Adjusted EBITDA and margin as a percent of gross bookings — the profitability trend that reframed the story. · Open the full presentation →p. 12 — Trailing-twelve-month free cash flow, from breakeven to $1.1B — the balance-sheet payoff of the model. · Open the full presentation →p. 13 — Q2'26 guidance: gross bookings, adjusted EBITDA and margin — the forward bar management set for itself. · Open the full presentation →
The full-year deck: annual framing, the product portfolio, the AV value-chain map, and the multi-year targets management is measured against. · Open the full document →
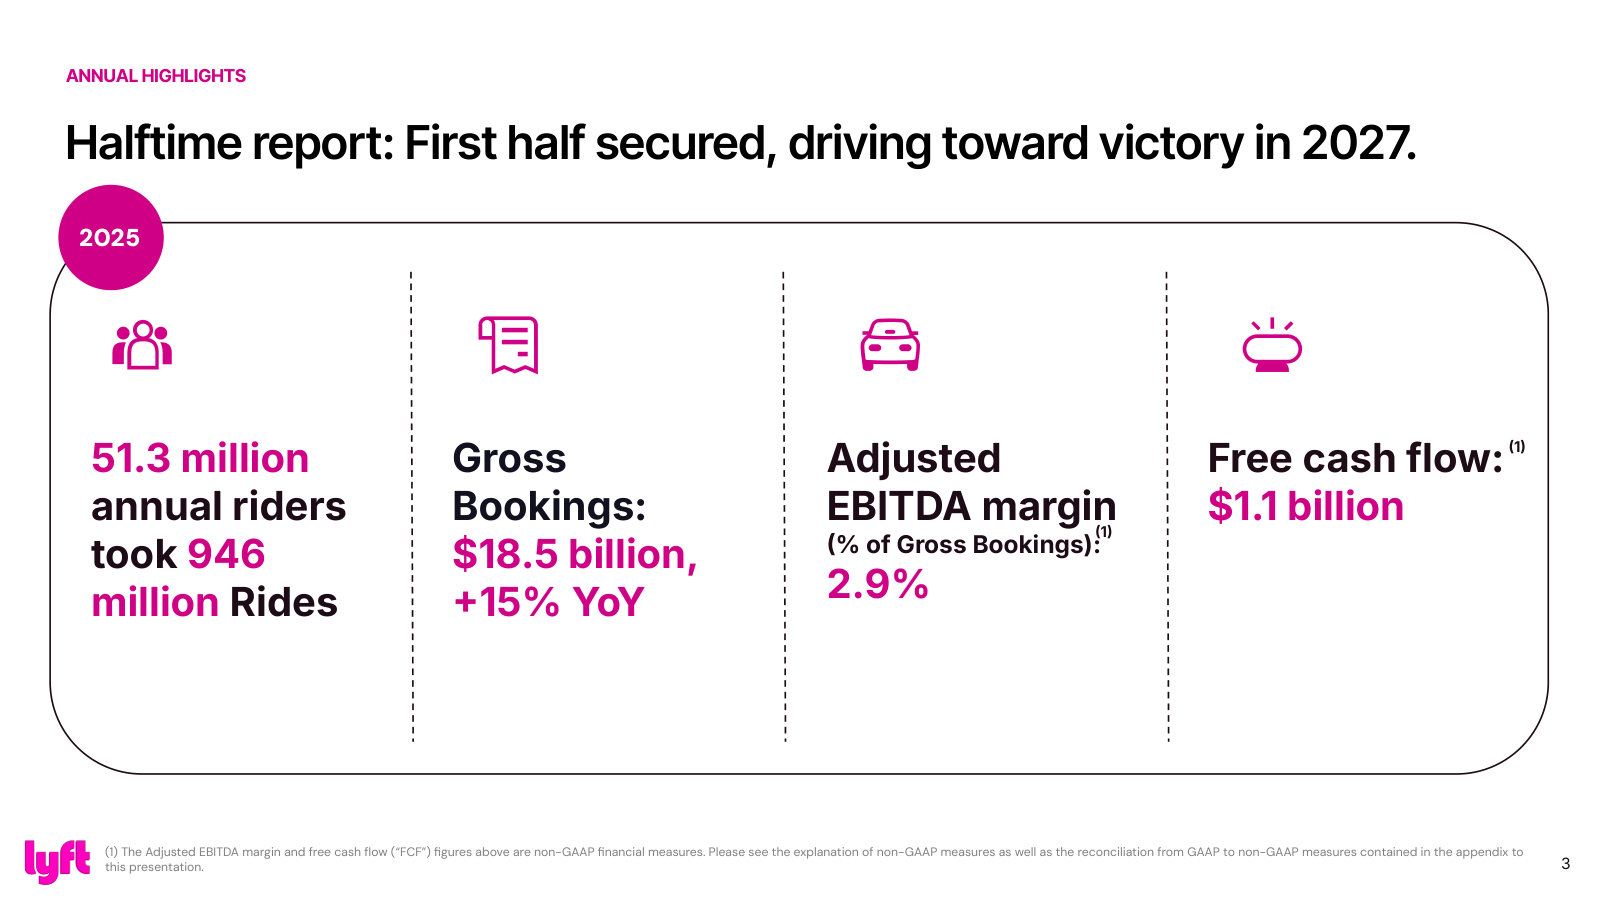
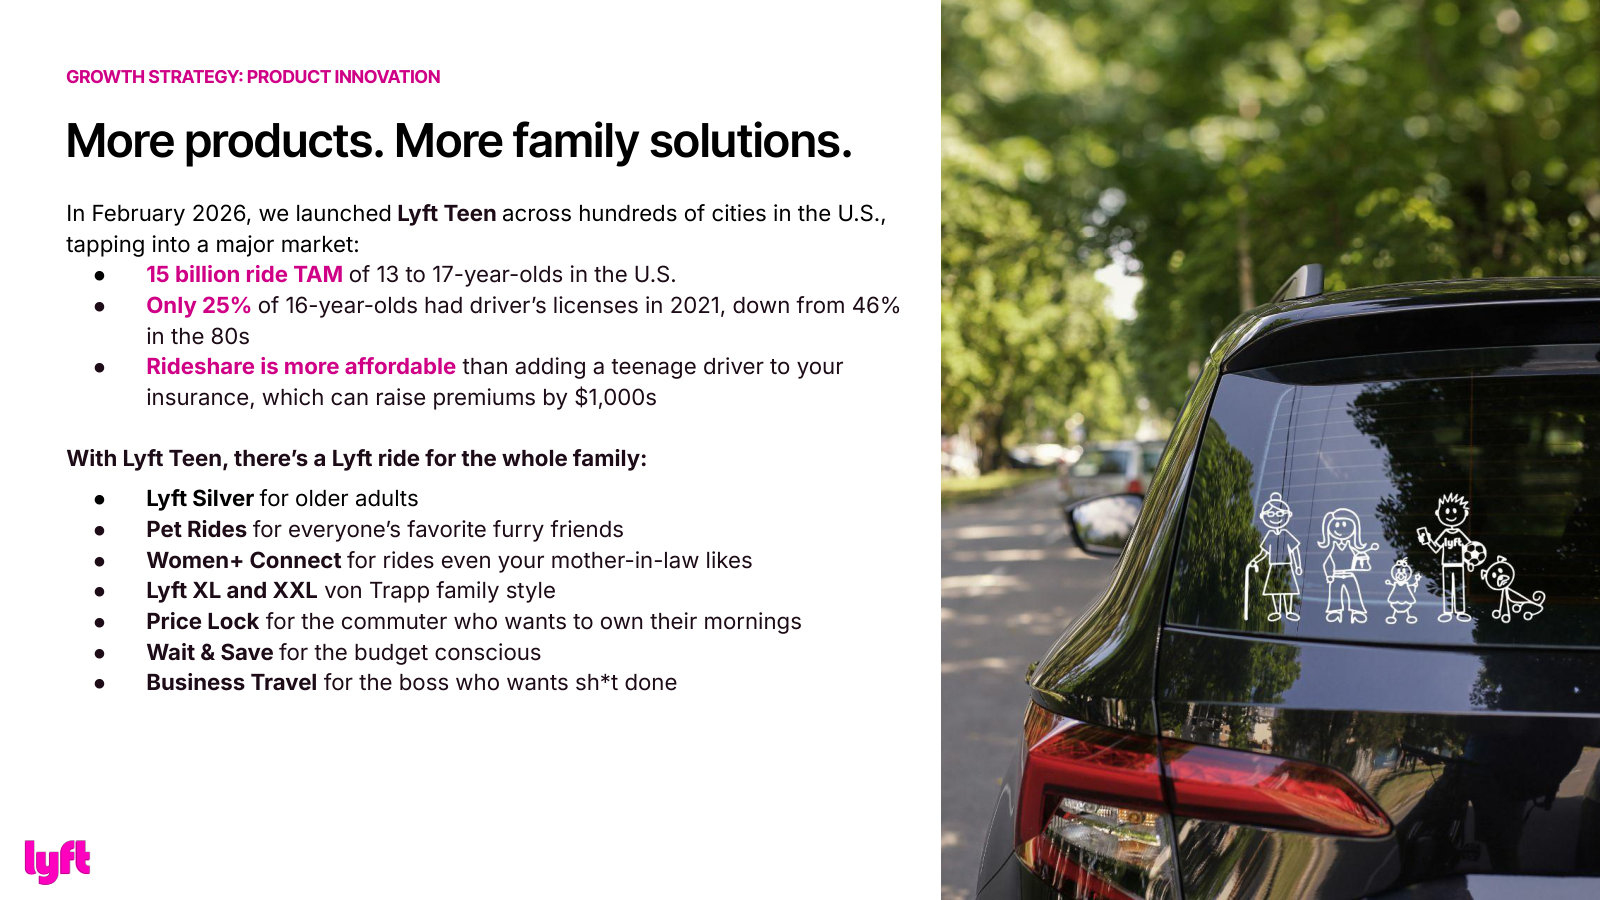
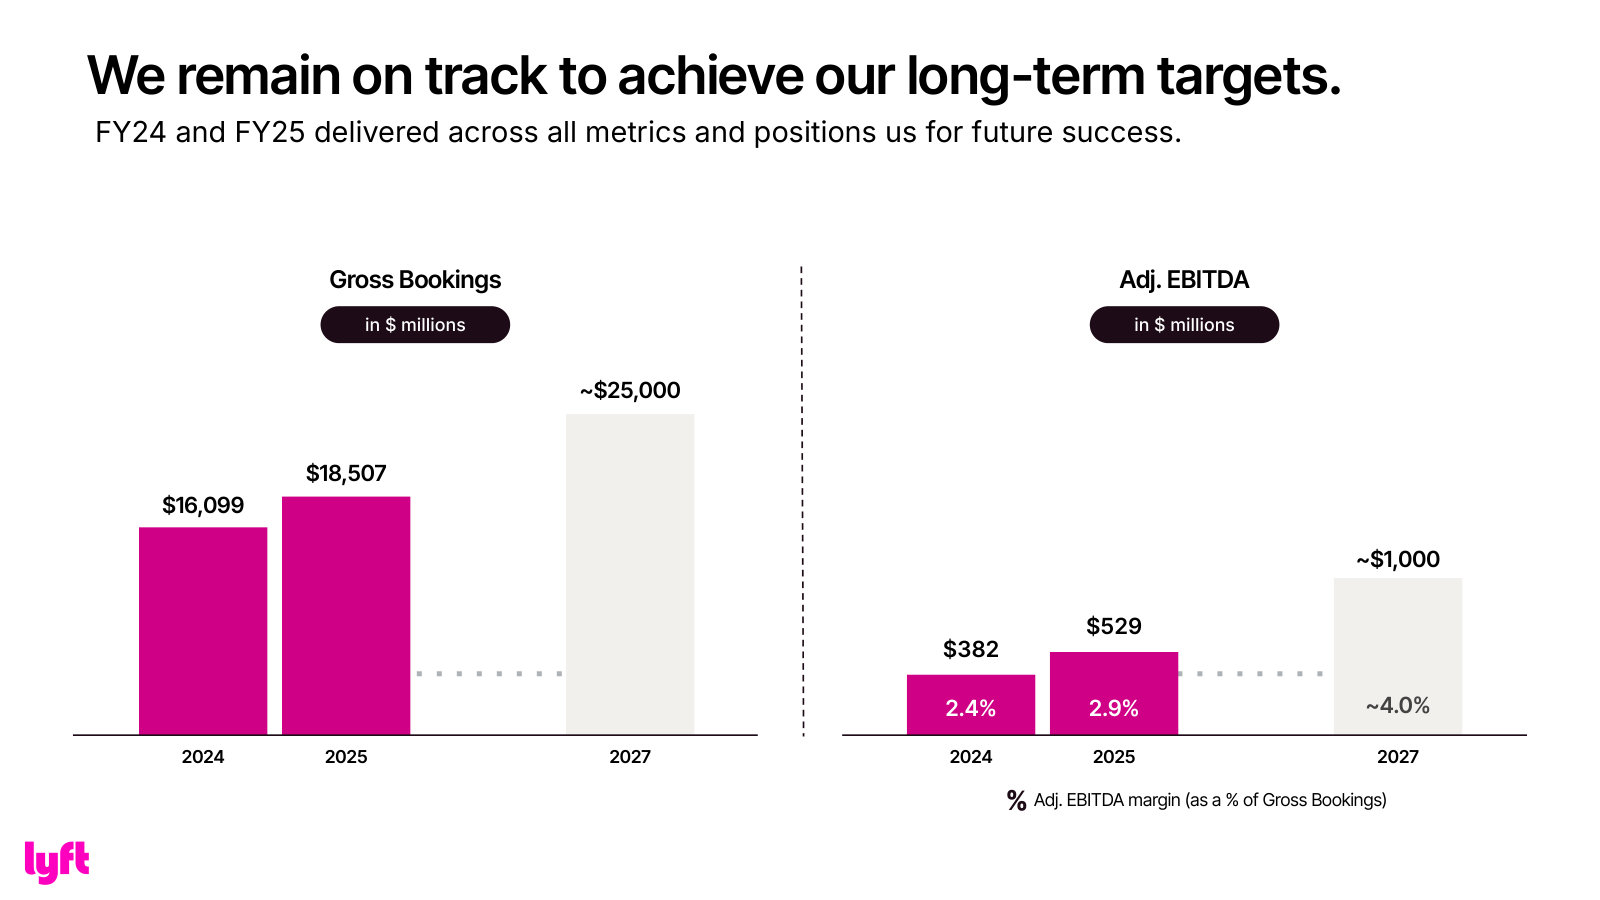
p. 3 — Full-year 2025 at a glance: 51.3M annual riders, 946M rides, $18.5B gross bookings, 2.9% margin, $1.1B free cash flow. · Open the full presentation →p. 4 — The product line-up in one slide — Lyft Teen, Silver, Pet, Women+, XL/XXL, Price Lock, Wait & Save, Business Travel — and the TAM logic behind Teen. · Open the full presentation →p. 6 — The AV strategy as a six-layer value chain, with named partners (Waymo, Baidu, Mobileye, Nvidia, May Mobility) mapped across each layer — the best single map of Lyft's AV positioning. · Open the full presentation →p. 14 — The 2027 long-term targets: ~$25B gross bookings and ~$1B adjusted EBITDA (~4% margin) — the yardstick for this management. · Open the full presentation →
Carries two slides the other decks don't: the US market-size framing and the incentive-per-ride trend behind margin expansion. · Open the full document →
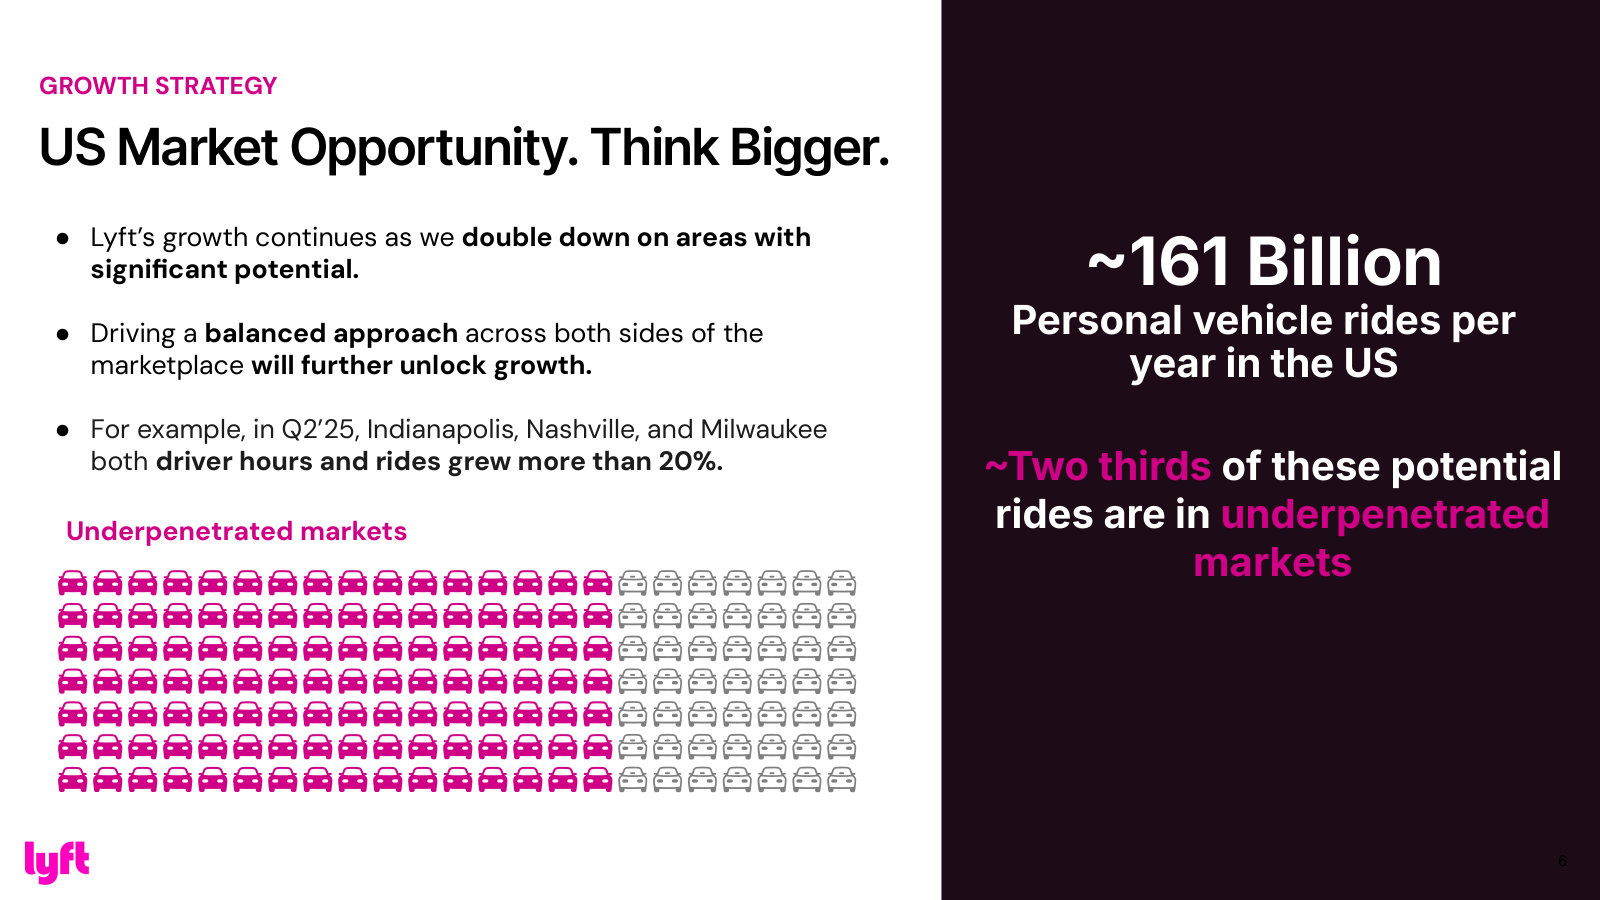
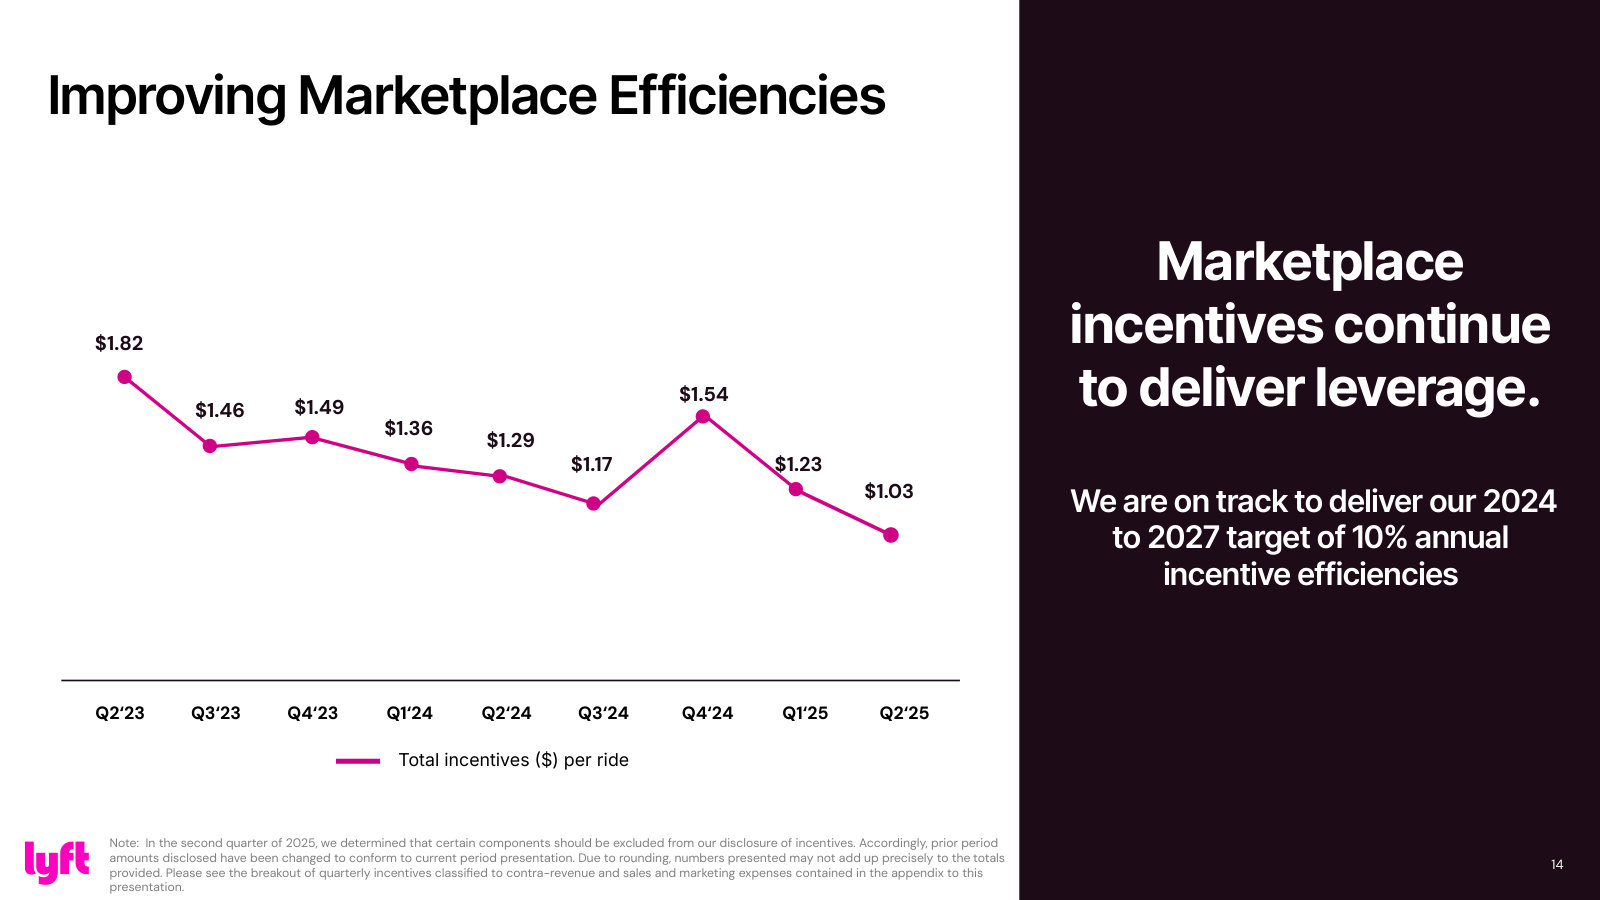
p. 6 — Market structure: ~161B US personal-vehicle rides a year, roughly two-thirds in markets Lyft calls underpenetrated — the growth runway in one exhibit. · Open the full presentation →p. 14 — Marketplace efficiency: total incentives per ride falling from $1.82 to $1.03 — the unit-economics lever driving margin, with a 10% annual efficiency target. · Open the full presentation →
Q3 2025 Earnings — Q3 2025 · 32 pages · The quarter Lyft first crossed $1B TTM free cash flow, plus a new-geographies map and an FY25–27 outlook slide. · Open →
Q4 & Fiscal 2024 Earnings — Q4 & FY2024 · 31 pages · The prior full-year deck — the FY2024 baseline the FY2025 and 2027 targets are measured against. · Open →
Q4 & Fiscal 2023 Earnings — Q4 & FY2023 · 32 pages · The earliest full-year deck in the set, marking the turn toward positive free cash flow — a useful starting point for the trend. · Open →